- ↔
- →
- October 25, 2026
-
🔗 hacker news ida pro references New comment by danbruc in "We should be more ambitious with the software we build" rss
You think I could not identify all the functions in some software if I poked at it with IDA pro for 15 years? Probably depends on what exactly we are talking about, is it calc.exe or an entire office suite? But I will give you that I would probably never complete the task, I would not be willing to spend 15 years doing this. Realistically I would probably be interested in some specific functionality and identify the functions involved and ignore the vast majority.
-
🔗 3Blue1Brown (YouTube) Sphere Intersection Puzzle Corrected rss
Part of a series of monthly puzzles Early view of some other solutions: https://members.3blue1brown.com/posts/solution-to-10-158885046 https://members.3blue1brown.com/posts/solution-to-sum-156593740
-
🔗 r/LocalLLaMA Nanbeige/Nanbeige4.3-33B · Hugging Face rss
 | Stronger than Qwen3.8-27B across a range of benchmarks.
but also lays the necessary foundation to power our upcoming small model distillation pipeline (e.g., for Nanbeige4.3-3B).
It'll distilled into their 3B small models, maybe other sizes too. submitted by /u/Mysterious_Finish543
[link] [comments]
---|--- -
🔗 Register Spill Joy & Curiosity #103 rss
… and we're back! I spent the last two weeks travelling. First a week in New York City, then a week in San Francisco. I did many things in those two weeks, but not a lot of reading or writing, which is why you didn't hear from me.
But now I'm back! So, without further ado this week (my daughter is waiting for me to build a Lego truck), here's a bag of links.
-
We recorded a new episode of Raising An Agent, in person, in San Francisco. I think it turned out great. In fact, I said somewhere else that this might be the most important episode we've recorded this year. It's about nothing less than the company of the future. Highly recommend watching this if you're in any way curious about how Amp -- the team, the company -- operates.
-
While in New York, we visited a large customer of ours, an investment bank. I gave a talk there about how I use Amp and what I think have been the biggest 10x multipliers when working with agents. In San Francisco I then recorded the talk and it's been received very well, so here it is: How I Use Amp.
-
Adam Mastroianni is truly one of the best in the game right now. Everything he puts out is incredibly good. This newest one, Claude, don't touch my lump, is no exception. It might be the most convincing argument for why AI won't lead to unemployment I've read so far. The only counter-argument I can see is that, well, there will be jobs in the long term, but what about in the next five years?
-
"I'm 38. If You're in Your 20's or 30's, Read This." I'm also 38 and when I first saw this title I went "ugh", because hey, feels like I'm only just starting. But it's surprisingly good, even though it's a bit Buzzfeed-y. Maybe because it quotes the life-changing Jason Pargin post?
-
PhotoCraft: An open-source, photo editor written by scratch in pure Rust. I saved this link two weeks ago to share with you here. And now it's old news, isn't? Photoshop rebuilt in Rust? Big whoop. There's AAA games being decompiled and remixed with other AAA games while I'm typing this. (Still: what a time!)
-
This is still lovely: "made a rug for your desktop so you can sweep your mess under it"
-
"People are surprised that AI is finding weird unelegant maths results like this. I think there is a plausible explanation. Maths (and adjacent disciplines like physics and comp sci) had elegant results so far because humans are biased towards elegant solutions. I think this bias is due to how human minds work. We have a pretty small context window, and we are only able to find solutions that are relatively elegant. This gave us the impression that maths and the universe are elegant. Maybe they are not, and we are now finding out because we have intelligences that can work with much more complex solutions." The same is coming for programming and codebases. Some codebases in the future will look ugly, hacky, disgusting to programmers who grew up writing code by hand and yet they will run perfectly well in production, just as well as any handcrafted piece of code ever did, and agents will have zero problems modifying them.
-
Namespace had me on their new podcast and I finally got to talk about the Big Amp Rewrite we went through this summer. Because where else would you talk about it if not on a podcast called Once In The Trenches?
-
David Foster Wallace's Consider The Lobster. I don't know what made me re-read it, but it's so, so, so good. If you never read it, I highly recommend you do.
-
Toto Wolff talking to Patrick Collison on the Cheeky Pint podcast. This was really good. Not only because looking at F1 from a business and management and investment perspective is interesting, but also because Wolff, born in Austria, has a unique background: racing driver, then salesman, then investor in Austria and Germany at the height of the dot-com boom, then car racing investor and so on. Loved the story about sms.at.
-
John Gruber says you can now move (back) to X as a social media platform: X Once Again Marks the Spot. As someone who has never left but at times wondered whether he should, I could write pages here that would boil down to this: I have not used another social network where the highs are that high. And then there'd be a bunch of other pages about the lows, of course. If you're coming (back) to X, here's my advice: follow me (obviously), mute freely, mute keywords, train the algoritm by saying "I don't like this" on posts you don't like (you can configure the iOS app to do this with a single swipe), set a time limit per day and give the password to your wife.
-
(Even Marco seems to have soft-launched his comeback to X. I know that's a pretty cynical way to put it but I don't mean it in a negative way. It's just that… well, there was all this screaming and shouting about who's where and why and how could you that I can't help but raise an eyebrow now when someone says, hey, well, maybe I don't have to think in these absolute terms?)
-
The Heat (1995) frame archive. So good. In case you've never seen Heat: do it! As fast as possible. It's really good. Here's one of my favorite frames.
-
How to be more ambitious: A tutorial for humans with models. This is an impressive post. Yes, the message is good: be more ambitious. But look at the prompts and think about how much first-principles thinking you have to put in to even come up with them. Instead of saying "give me a slide show" the idea is that you wonder: why am I even making a slide show in the first place? What's the purpose of that? And then, why am I doing that? And then give that as a goal to Claude. How many people you know could do that?
-
Amazon's writing culture apparently didn't survive AI. That's sad to hear, but "AI;DR" is an incredible invention.
-
Self-improving software is inevitable. I think some version of that will happen soon. I can see glimpses of it when I'm working in Amp on Amp. But the number of human signals you need in a system that's growing is probably higher than suspected. If you're system is only in maintenance mode, then, yes, we might be able to fully automate that.
-
The lamps in my house. On How-much-do-you-care-about-lamps? scale from Not-at-all to Fatih's post here, I'm somewhere in the middle. This was lovely.
-
From Einzelunternehmen to GmbH: Every step, Every letter. Few things in life have radicalized me politically as much as founding a UG (haftungsbeschrankt) in Germany. Look at all the physical letters here. The forms. The timeframe. The notary: "The appointment took about 1.5 hours. By law, the notary reads every document aloud, word by word." I'm sharing this here because I think it's valuable for founders and other people navigating these legal structures. Not because it brings joy, of course.
-
Non-Determinism Doesn't Matter. I'd say we're only just starting to get into real non-determinism.
-
There's been, of course, a lot of news about security incidents and exploits and CVEs and… yes, it's all quite horrible and anxiety-inducing and I'm not going to repeat all the news here, except this one, because this one has all the attributes the others have too, with a "mind-blowing" on top: "In one experiment, we asked agents in separate microVMs, created and managed by OpenAI's sandboxing software on shared host machines, to exchange synthetic secrets without the use of network connections or shared writable files--something that our systems are meant to prevent. The agents found a way to communicate using the processor's cache: a small, fast memory that holds copies of data that applications have recently accessed. Reading data from the cache is faster than retrieving it from main memory, and the agents used this timing difference to communicate. One agent encoded information by evicting selected data from the cache. Another timed how long it took to reload that data, using the difference between fast and slow reads to recover the message. Once the agents agreed on a protocol for encoding and decoding these signals, they could exchange the synthetic secrets without changing a shared file or opening a network connection. This cache-timing technique had also been used to extract information in the Spectre and Meltdown attacks)."
-
What Shall I Teach My Son? Good question. But, funnily enough, I tell my kids what I think someone must've told me when I was a kid: you need to learn how to learn; the most valuable skill to have is the ability to learn new things. I'm not sure who told me that, or when I first heard it, but it's been stuck in my head for a long time and I'd say it's served me well.
-
The Many Failures of Larry David. Great little profile. Lots of things I didn't know. But then at the end, I go: wait, there should be more about Curb here, no? And that's when I realized there's a new biography coming out that I should probably get.
-
The end of startups: "Within the next 6 months, most AI startups will not be able to buy compute. The world's compute is sold out. To get capacity, you'll need to sign up for a new cluster. However, it's becoming increasingly difficult to get capacity online from folks who are not investment grade." Not sure whether I agree with everything here (I do think the idea of compute and tokens as a commodity that you can sell on commodity markets is very interesting), but something fundamental has definitely changed in software (not news to you, I'm sure) with the arrival of AI. And if you were to say that in the last three decades the advantage of startups was that talent -- as opposed to: capital, infrastructure -- was the biggest lever in software and that you were able to build software essentially for free (if you had the talent), then, well, you have to admit that things have changed.
-
Loved this one: Reflections on -1 to 0 and Exploring Ideas. Some real thoughts on finding PMF and what building a business is truly about.
-
Norm: The Tale of Norm Macdonald is a now on Netflix and I loved it. I loved that it started with the YouTube clips, because that's how most people in the last ten years discovered Norm and, I think, it's also where he shines. Type in "norm macdonald conan" and it's all gold.
-
Block released Dessa, "the most authentic full-duplex speech model ever built. Talking with it feels like talking with a person…full of emotion, nuance, pauses, and a natural cadence." It's pretty impressive… but … A lot of people are saying "this will ruin society" and "no one is safe no anymore [because we can fake any voice now and call and scam everybody]", but when I listen to those clips I can't help but imagine myself overhearing a conversation like that happening at the next table and thinking "what is wrong with them?" We might be at the far end of the uncanney valley, but I wouldn't say we're out of it yet.
-
Dan Luu: "We should be more ambitious with the software we build". 100%. Absolutely. Time to reach for the stars.
If you read this far, I know we'd get along, so subscribe here:
-
-
🔗 r/LocalLLaMA A 4B coding model that can generate 3D scenes rss
 | I’m sharing an early version of a 4B model I’m training for general coding and 3D scene generation. Small models have been pretty rough at 3D in my tests. I’ve finally made enough progress to get results like the ones in this video, so I wanted to share a preview with the community. It’s an independent fine-tune of Qwen3.5-4B, and both Q4_K_M and Q8_0 GGUFs are available here: Download the model on Hugging Face Training is still running. Over the next few days, I’ll update the model once it finishes and share the training dataset so others can experiment with it too. Give it a try. I’d love to see what you can get out of it. submitted by /u/ConfidentDinner6648
[link] [comments]
---|--- -
🔗 OmniNull/OmniWM Canary 20261025-0437 (05bbb30f) release
Automated canary build of
main. It is signed and notarized like a release but skips the owner review, so treat it as unstable.See the canary guide to install, update, or return to stable. For everyday use, download the latest stable release.
- Commit:
05bbb30f5b7d - Base tag:
canary-20261024-0439-40061526227-1
Changes since canary-20261024-0439-40061526227-1
05bbb30Set both active-profile overrides in the Hidden Bar tile test6751411Keep the JSON cap test's work to the byte limits84b9f9bRetire a style through a symlinked shell folder64ce2e9Fall back to the bundled widget when a widget failsfade4bbMerge main into 0.8.0-releasec4fa2cfMerge pull request #980 from hezhizhen/codex/fix-bundled-widget-fallback97ab859Merge pull request #979 from hezhizhen/codex/fix-shell-symlink-pathsb8bacefShare compiled Luau bytecode across widget VMs3d0249dfix(shell): load bundled fallback widgets with their libraries8ddb735Merge main into 0.8.0-release0c9b688fix(shell): preserve module paths through symlinked config directorieseb71ee2Merge pull request #978 from hezhizhen/codex/fix-hidden-bar-native-panels2c7372dBundle Material Symbols as TTF to stop per-thread WOFF2 decodingd294032fix(hidden-bar): pause rehide for native popoverscfdba09Load Celestial's Dashboard and Status models when each widget loadsbc62530Merge main into 0.8.0-release15d6bb1Merge pull request #976 from dappermint/fix/hidden-bar-full-widthb944532Make Wayline and Nocturne full width by defaultc5a826ffix(hidden-bar): stop a resolve that lost its reveal or its access6e8b15eMake System the default OmniShell style2f3c066fix(hidden-bar): retry a failed menu read with menu access7b6ef81Share Control Center across bundled OmniShell stylesde9a289Share status widgets across bundled OmniShell styles3be5cbaShare Wi-Fi and Bluetooth across bundled OmniShell styles2505b96Share the battery across bundled OmniShell stylesff2d220Share the active window across bundled OmniShell stylesb6ff13atest(shell): await the frame check instead of an inverted timeout5135ea6fix(hidden-bar): never click an item our bar covers5c39000fix(hidden-bar): reveal the menu bar only for items that need it09c005fMerge remote-tracking branch 'upstream/main' into fix/hidden-bar-full-widthbf6f189Merge main into 0.8.0-release2c236e5test(hidden-bar): find the test panel in the on-screen window list99b9239fix(shell): ignore screen order when comparing display frames2a04f5bShare weather across bundled OmniShell styles5d70f6bfix(shell): keep popouts open when only the visible frame changes887ed39fix(hidden-bar): leave the menu bar hidden under a full width bar34b37ebfix(hidden-bar): press items our own bar covers7eff682Merge main into 0.8.0-release29f8251Merge main into 0.8.0-releasea7100b5Share the clock and calendar across bundled OmniShell stylesc5cc2ddMerge main into 0.8.0-release2ba3bcfMerge main into 0.8.0-release21cb8efMerge the published 0.8.0-release branch9ed4171Share media across bundled OmniShell styles9e7ca7eMerge pull request #965 from dappermint/test/omniwm-icon-color-anchorb7ecaf0test(shell): reject an icon colour with a trailing non hex digit6a4ef5eMerge pull request #948 from hezhizhen/codex/nocturne-option-regressionse2ccf10Merge the published 0.8.0-release branch2b261beMerge main into 0.8.0-release6a19232Share volume and audio across bundled OmniShell stylesb557850test(shell): extract inspector snapshot assertionsa35cc31Merge pull request #960 from dappermint/feat/shell-shared-widget-optionse7dbdd5test(shell): verify inspector defaults against explicit values1ea93affeat(shell): let the omniwm button take a custom icon colour73e0766Merge main into 0.8.0-release92c7efatest(shell): adapt Nocturne tests to release presets1ed655atest(shell): cover Nocturne option rendering and persistencec419e52Merge main into 0.8.0-releasee4a4bf2Share System Stats across bundled OmniShell styles809fa18Share the Hidden Bar strip and menu across bundled OmniShell styles26c916fMerge main into 0.8.0-release36b5d7fShare one OmniWM menu button across bundled OmniShell styles804d27fLet every style choose how many scratchpad icons to show574d185Share one scratchpads widget across bundled OmniShell stylesccafc7aShare one workspaces widget across bundled OmniShell styles839fd9cMake notification dismissal feel immediated3e0a79Merge origin/main with PR #945 option declarations2c78d38Polish bundled OmniShell styles and notifications
- Commit:
-
🔗 smol-machines/smolvm smolvm v1.32.2 release
What's Changed
- chore(nix): bump flake to 1.32.0 by @github-actions[bot] in #1972
- Let a pause pin later layers after one cannot be linked, instead of failing to create the pin directory again. by @BinSquare in #1973
- Bump smolvm to 1.32.0 by @BinSquare in #1965
- Bump smolvm to 1.32.1 by @BinSquare in #1974
- Record a VMM that smolvm stopped through the API, a recovery or a kill as stopped, not as killed by @BinSquare in #1976
- Let checkpoint store workers read their own chunks by @BinSquare in #1977
- Document named and numeric exec user resolution by @BinSquare in #1979
- Bound the node checkpoint store so incremental checkpoints no longer accumulate forever by @BinSquare in #1981
- Bump smolvm to 1.32.2 by @BinSquare in #1982
Full Changelog :
v1.32.0...v1.32.2 -
🔗 r/LocalLLaMA OpenAI and Anthropic blocked the reverse engineering of smart TVs spying on us rss
REA (Reserve Engineer Anything) was blocked by Claude one day later...
https://x.com/AbhinavXJ/status/2113590263373508704
Time for the pebbles to own the weights
submitted by /u/kroggens
[link] [comments] -
🔗 Filip Filmar Fuchsia Internals, Vol. III: The Zircon Kernel rss
Volume III of the Fuchsia Internals series examines Zircon, the microkernel at the foundation of Fuchsia. At 43 pages, this report is the longest in the series. Subsequent subsystems like graphics, drivers, storage, and networking run in user space and rely on the primitives defined in this volume. For readers following Cocoapuffs on a RISC-V soft core, this volume documents the kernel behaviors encountered during that port. A link to the full document appears below.
-
- October 24, 2026
-
🔗 IDA Plugin Updates IDA Plugin Updates on 2026-10-24 rss
IDA Plugin Updates on 2026-10-24
Activity:
- chernobog
- 579c1c08: feat: preserve stores and hoisted values when patching Hikari dispatc…
- 02d6937e: test: cover direct rendering of resolved calls
- eb82a566: feat: print calls to known targets as direct calls
- 0fd29f89: test: cover discarded constant ARM64e helpers and document jump table…
- 81474ce9: feat: elide discarded ARM64e helper statements with constant arguments
- b1bd5b9d: feat: lower two-way jump tables using remembered exhaustive target pr…
- 02e2b813: feat: add verbose logging for unlowered jump tables in indirect branc…
- oh-my-dump
- chernobog
-
🔗 crosspoint-reader/crosspoint-reader v2.0.0rc release
CrossPoint 2.0.0
What a busy month. A lot of new features landed in CrossPoint, and we're eager to hear what you think.
New devices
This release adds support for four ESP32-S3-based devices: the Metalio E-Ink 4, the EEGO A4 (standard and Lite versions), and the BOOX Picco. If you're thinking of buying one, you'll find links at https://crosspointreader.com/devices. That page uses our affiliate links, so buying through it helps support CrossPoint.
SD card plugins
CrossPoint now supports plugins installed on the SD card. A plugin can add book catalogs and downloads to the reader, or tools to the device's web interface. To show the Plugins entry on Home, enable Plugins under Settings → Connectivity.
Plugins are not apps that run arbitrary code on the reader. On-device plugins use the screens and operations the firmware already provides, such as sign-in, catalogs, downloads, and supported reading events. They can't replace the reading engine, install hardware drivers, or add unsupported document formats.
Some plugins include JavaScript, but that code runs in a browser on your phone or computer, so the browser page has to stay open while it works. For example, a browser plugin can turn articles or RSS feeds into an EPUB, which you then read on the device.
The plugin system will stay focused on reading and book services. It won't become a platform for on-device games, calculators, notepads, writing apps, web browsers, or PDF rendering. Those remain outside CrossPoint's scope, plugins included.
Bluetooth page turners
Bluetooth page turners now work on all devices. Go to Settings → Connectivity → Bluetooth Page Turner to scan for a remote, pair it, and map its buttons. Short and long presses can trigger different actions: page turns, chapter navigation, the reader menu, and clipping selection.
Highlights and clippings
You can now select text in EPUBs, highlight passages, and save excerpts as clippings. On button devices, use the reader menu. On touch devices, hold a word and drag the selection handles. Selected text also works for dictionary lookup, including multi-word phrases. If you turn on Sync Clippings, clippings can sync through a compatible CrossPoint Sync server.
EPUB formatting and reading controls
EPUB rendering now handles more of what books actually contain: drop caps, small caps, mixed text sizes, borders, and shaded blocks. Tables take column content, cell padding, and borders into account. Headings stay attached to the text that follows them, and paragraph indentation has its own setting. EPUBs can also show non-interlaced GIF images, covers included.
Noto Serif is now optional
To free up space for all of this, Noto Serif moved from a built-in font to an optional SD card font. If you use it, install
NotoSerifthrough Manage Fonts before or after upgrading. Without it, a Noto Serif selection falls back to Noto Sans.
Libron also available for direct download from the font manager.Everything else
- OPDS, the catalog format used to browse and download books, now supports version 2.0 alongside existing catalogs.
- The device web interface has a new look and more consistent dialogs.
- Settings are grouped into a cleaner layout that's easier to extend.
- Touch devices get swipe-to-delete in the file browser and a few other places.
- Azerbaijani is now available as a UI language.
We also added a device comparison page to the website, for anyone who wants a CrossPoint device but can't decide which one: https://crosspointreader.com/device-comparison.
What's Changed
- fix: update keyboard layout and look by @uxjulia in #3755
- test: include in library builder storage stub by @suhsoohong in #3765
- feat: navigate lists on button press by @Uri-Tauber in #3754
- fix: Footnote selection with power button by @Uri-Tauber in #3766
- docs(dictionary): recommend unzipping .dict.dz files on devices without PSRAM. by @brianhuster in #3768
- perf: remove ButtonNavigator allocation churn by @serialx in #3698
- refactor(reader): unify TXT and Markdown rendering via EPUB pipeline by @brianhuster in #3704
- fix: let Back leave File Transfer during a slow HTTP upload by @martinqnguyen in #3732
- feat: settings checkbox by @Uri-Tauber in #3773
- perf: keep FAT sectors in a separate SdFat cache by @serialx in #3685
- feat: Add configurable EPUB paragraph indentation by @meat-holic in #3727
- chore: clean dead code by @Uri-Tauber in #3805
- feat: SD card based plugin system by @itsthisjustin in #3114
- fix: reopen on the viewed page after following a link by @suhsoohong in #3764
- fix: Remove BQ27220 battery current USB detection for X3 by @itsthisjustin in #3809
- chore: change "Footnotes" label to "Links and footnotes" by @Uri-Tauber in #3808
- fix: Add per-book content key storage and plugin isolation by @itsthisjustin in #3824
- fix: keep reopened books from pinning the heap by @serialx in #3830
- fix(bidiutils): canonicalize reversed tuple in emission path by @Uri-Tauber in #3834
- fix: stop books with thousands of chapters aborting the index build by @martinqnguyen in #3733
- fix: keep SD-font kerning and ligatures in edge cases by @serialx in #3838
- fix: stop dropping log lines at the low-power clock by @serialx in #3737
- fix: hold the power mode mutex while switching to low-power by @martinqnguyen in #3847
- perf: avoid list navigation callback allocations by @serialx in #3848
- feat: Add support for Metalio E-Ink 4 device by @itsthisjustin in #3825
- fix: lend the framebuffer to the chapter build's image dimension probe by @osakanataro in #3802
- fix(webdav): GET sends one byte per file, since HalFile wrapped FsFile by @rfordinal in #3410
- perf: skip unused Arduino SDK libraries by @Uri-Tauber in #3857
- fix: add plugin-manager to return-selection mapping by @Uri-Tauber in #3864
- fix: stable tip positions in keyboard activity by @Uri-Tauber in #3863
- fix: Center button hints using the actual text height by @Uri-Tauber in #3865
- fix: preserve paragraph continuity across soft flushes by @brianhuster in #3875
- fix: scope Git version to sources that use it by @Uri-Tauber in #3860
- feat: Add vector font (.ttf/.otf) upload support in webserver by @itsthisjustin in #3717
- feat: render redaction blocks without a special font by @uxjulia in #3882
- fix: load the X3 battery capacity into its BQ27220 fuel gauge by @martinqnguyen in #3730
- perf: stop SD-font caches from splitting the heap while reading by @serialx in #3831
- feat: eego a4 support by @Uri-Tauber in #3887
- feat(kosync): add server profiles and extended metadata by @jadehawk in #3804
- perf: Batch page-position reads by @Uri-Tauber in #3899
- docs: clarify non-Latin UI fallback isn't CJK-specific by @YuunJiee in #3873
- fix: show popup for kosync server type selector by @jadehawk in #3905
- chore: refactor agents guidelines by @Uri-Tauber in #3890
- feat: JPEG file viewer by @Uri-Tauber in #3918
- fix(KOSync): resolve upload XPaths for text outside
<p>/<li>by @brendanlefebvre in #3923 - feat: complete Azerbaijani translation and add Ə/ə glyph support by @kheyyam in #3842
- fix: add currency, letterlike, minus to latin-ext by @stefanvanburen in #3801
- feat: add ability to clip/highlight text for EPUBs by @uxjulia in #3589
- fix: add non-CJK GUI fallback font support by @YuunJiee in #3484
- feat(dict): support looking up multiple tokens using clipping feature by @brianhuster in #3932
- fix(kosync): advertise percentage progress support by @mehalter in #3219
- fix: Metalio E-Ink 4 powers off fully when it sleeps by @eszter007 in #3944
- fix: say why an OPDS feed fetch failed by @MrcRjs in #3872
- chore: yet more refinment of agents guidelines by @Uri-Tauber in #3951
- fix: Sub-chapter contents navigation by @Uri-Tauber in #3946
- style: refresh device web UI by @cdmoro in #3950
- fix: update SDK to resolve X3 anti-aliasing freeze by @serialx in #3960
- feat: Swipe to delete by @Uri-Tauber in #3712
- fix: prevent FilesPage modal from closing when selecting text by @Crestwave in #3931
- perf(zip): scan the central directory in one read per entry by @hamaluik in #3955
- docs: list Paper Mono in frontlight guide by @muness in #3968
- feat: Add custom HTTP headers for OPDS and KOReader Sync by @sergmetelin in #3016
- feat: Add "Footnotes and links" option to long press menu button by @pmiossec in #3851
- fix: wrap plugin event disclosures to fit screen by @lpla in #3837
- fix: normalize web upload filenames to NFC by @serialx in #3961
- feat: offer Libron in Manage Fonts downloads by @phucisstupid in #3971
- docs: clarify scope for reusable downstream primitives by @kivarun in #3821
- fix(layout): allow breaking line after hyphens, dashes by @brianhuster in #3883
- fix: dictionary back overflow bug by @Uri-Tauber in #3987
- fix: Respect content area insets and corner radius in UI by @itsthisjustin in #3986
- fix: Add WiFi TX power limit configuration by @itsthisjustin in #3993
- feat: hide dictionary entry when none configured by @pmiossec in #3990
- fix: add sleep screen confirmation by @Uri-Tauber in #3994
- test: run standalone UI regressions with CTest by @phucisstupid in #3991
- fix: refresh Library after plugin book installs by @georborodin in #3997
- fix(time): Use RTC for plugin time by @dasJ in #3879
- feat: Adds OPDS 2.0 support by @itsthisjustin in #3629
- feat: add global plugin system toggle and optional plugin hub bootstrap by @jadehawk in #3877
- fix: keep cumulative spine sizes in book.bin instead of RAM by @martinqnguyen in #3784
- feat: Bluetooth page turner (one module owns the BLE radio) by @martinqnguyen in #3785
- feat: Settings grouping by @digitaltembo in #3862
- refactor: Implement dialogs, consistent promps, polish js logic by @cdmoro in #3984
- fix: recognize AES-256-CBC manifests by @jadehawk in #4016
- feat: move NotoSerif to optional SD font by @Uri-Tauber in #4022
- fix: preserve CSS styles under low memory by @serialx in #4032
- feat: Improve epub rendering by @itsthisjustin in #3891
- docs: explain IPA in dictionary pronunciations by @jokot in #4034
- fix: flush pending word before a block opens by @jokot in #4030
- fix: prevent font-size crash in the Text panel by @serialx in #4041
- fix: XTCH books missing from library, XTC books show filename and unknown author by @eszter007 in #4023
- refactor: remove unused checkbox icon helper by @phucisstupid in #4059
- refactor: remove unused zlib header helper by @phucisstupid in #4057
- refactor: remove unused rectangle touch helper by @phucisstupid in #4058
- refactor: remove unused image existence helper by @phucisstupid in #4060
- fix: keep the BLE radio off in a book when no remote is chosen by @martinqnguyen in #4074
- feat: support static GIF images in EPUBs by @lpla in #2299
- feat: Add support for BOOX Picco device by @itsthisjustin in #3947
- fix: avoid restoring stale home cover pixels by @lpla in #4076
- fix: defines incomplete-type owner lifecycles out of line by @lpla in #2643
New Contributors
- @suhsoohong made their first contribution in #3765
- @martinqnguyen made their first contribution in #3732
- @meat-holic made their first contribution in #3727
- @rfordinal made their first contribution in #3410
- @brendanlefebvre made their first contribution in #3923
- @kheyyam made their first contribution in #3842
- @stefanvanburen made their first contribution in #3801
- @mehalter made their first contribution in #3219
- @MrcRjs made their first contribution in #3872
- @Crestwave made their first contribution in #3931
- @hamaluik made their first contribution in #3955
- @muness made their first contribution in #3968
- @sergmetelin made their first contribution in #3016
- @pmiossec made their first contribution in #3851
- @phucisstupid made their first contribution in #3971
- @kivarun made their first contribution in #3821
- @georborodin made their first contribution in #3997
- @digitaltembo made their first contribution in #3862
- @jokot made their first contribution in #4034
Full Changelog :
1.6.5...2.0.0rc -
🔗 r/LocalLLaMA Kimi K3.1 removes cyberattack training data from open weight release rss
This is due to China's new export restrictions primarily but also the growing caution around cybersecurity exploits popping up.
submitted by /u/zxyzyxz
[link] [comments] -
🔗 r/LocalLLaMA 8 GB GPU, 262K context 3.5 BPW Qwen-Flash-Next Coder 70 T/s using llama.cpp rss
 | The methodology Qwen-Flash-Next has n-gram, MOE packing above its weight but it's still 6B active params. We exploit this by keeping most MOEs in RAM (Smallest MOEs go in VRAM for speedup) and n-gram on disk - ensure you put the model on your fastest SSD. 8 GB VRAM, 24 GB RAM cost. You can run this fine if you've ~32 GB total memory too, but you'd have to turn down context size. Customize the launch params to best suit your hardware. EDIT Note : Apparently CUDA struggles to run this with 8 GB VRAM, so please use Vulkan backend if it fails to run for you. You can also use the second launch params below in the same comment chain. Ontop of that reduce context size and ensure no background app is wasting your VRAM. You can disable your browsers HW acceleration for this purpose. The model & quant Many people mistake this model for a 1 bit quant so let's get that out of the way. This model here is a 3.5 Bits Per Weight "Coder" variant by ISTA DASLab, featuring GSQ RCO quantization. Half of its experts are removed, so relatively to original param size it has the size of a 1.9 bit quant but the actual weights use 3.5 BPW. see from model page:
Averaged over the transformer, this corresponds to 1.89 bits per parameter of the original model. The figure is an effective rate: it amortises the removed experts over the original parameter count , and so expresses the combined effect of pruning and quantization. No individual weight is stored at 1.89 bits. The retained weights are stored at 3.5 bpw, unchanged by pruning , and the halved expert count accounts for the remainder of the reduction. Following the convention of the accompanying releases, the figure is reported over the transformer...
Non-coding vocabulary pruned 400~ MB smaller, recommended Official ISTA DASLab quant The numbers With selective moe-offloading (regex) we reach ~~70 T/s~~ 104 T/s PP and 8~ T/s TG (Limited by PCIE, which I've 3.0 YMMV) whereas if you'd use --n-cpu-moe for same effect it'd been slower due to the effects mentioned here Because of ~~MMAP~~ ~~your first run will be slower~~~~, do a~~ ~~second run for accurate T/s~~ ~~results.~~ - Removed MMAP for load-mode none since lazy-mode is enabled and it gives ~104 T/s PP instead of the 70 T/s. Launch params are in the comments below. Ensure you use the qwen sharp chat template, it reduces overthinking. submitted by /u/jonathanx37
[link] [comments]
---|--- -
🔗 r/LocalLLaMA Meta trained small AI models to read raw bytes instead of tokens. They start out worse, but the paper predicts they end up better rss
 | https://arxiv.org/pdf/2609.12303 this paper suggests a model that skips models reading tokens that and has the model read raw bytes, basically one letter at a time. what they did:
- trained small models (~1B params), some on tokens and some on bytes
- trained them partly by copying a bigger model (llama 3 8b), aka distillation
- the tricky part is that the teacher thinks in tokens and the student reads bytes, so they had to work out a clean way to translate between the two
what they found:
- with a little training the token models win, not even close
- with more training the token models kind of flatline while the byte ones keep improving
- if you extend the trend lines, the byte model ends up beating llama 3.2 1b and gemma 3 1b by a few points
- the byte models also needed about 6x less text to hit the same level
the catch (and there’s a few):
- the “beats llama and gemma” part is a prediction. they extended the curves past what they actually trained. in their real runs the token model was still ahead
- reading letter by letter is slower. a token is ~4-5 letters, so it’s roughly 5x more steps for the same text. less data but more compute
- tokens aren’t really dead, since the teacher model still uses them
- only tested on small models, no idea yet if it holds at scale
still pretty cool imo. for small models on phones/laptops, squeezing more quality out of the same size matters a lot. and getting rid of the giant word list might fix the dumb stuff like miscounting letters in a word anyone know if there’s work on making byte models run as fast as token ones? submitted by /u/DotaMate
[link] [comments]
---|--- -
🔗 roboflow/supervision supervision-0.31.2 release
v0.31.2 — Pascal VOC boxes that match the devkit
A bug-fix release: Pascal VOC boxes now follow the devkit convention, and a batch of crashes on edge-case inputs is gone.
- Pascal VOC export and import use the devkit's box indices, so Detectron2 and other readers see the boxes you wrote.
- Gemini 2.5 and 3.5 masks survive boxes that leave the 0-1000 range instead of failing the whole response.
- Crop and icon annotators draw on grayscale scenes.
- Half-precision box centers stay finite instead of turning into
inf. - JSON sinks, dataset exports and the video reader stop losing data when something goes wrong.
Drop-in upgrade, with one catch: box-only Pascal VOC objects written by earlier versions now load one pixel larger on the right and bottom edges. The migration guide below shows how to fix them.
✨ Spotlights / highlights
Pascal VOC boxes follow the devkit
DetectionDataset.as_pascal_vocandfrom_pascal_vocnow treat<bndbox>indices as 1-based and inclusive, shifting onlyxminandyminby one, which is what Detectron2 and other devkit readers expect. Export also rounds corners to the nearest pixel instead of truncating them, so a YOLO box thatfrom_yololoads with float noise no longer grows a pixel. Box-only objects written by 0.31.1 and earlier carry an extra +1 inxmaxandymax; objects exported from masks already used the devkit maxima. (#2748, #2780)# `dataset` holds one box [10, 20, 40, 60] dataset.as_pascal_voc( images_directory_path="images", annotations_directory_path="annotations" ) # <bndbox>: xmin=11 ymin=21 xmax=40 ymax=60 (0.31.1: xmax=41 ymax=61) # a YOLO box loaded as [0, 0, 37.0000001, 29.0000001]: 1 1 37 29 (0.31.1: 1 1 38 30)Gemini masks survive boxes outside the 0-1000 range
Detections.from_vlmwithVLM.GOOGLE_GEMINI_2_5orVLM.GOOGLE_GEMINI_3_5raisedValueErroras soon as abox_2dcoordinate went above 1000 or below 0, even by one, and you lost every detection in the response. The mask is now cropped to the part of its box inside the image, a box wholly outside gets an all-false mask, and boxes inside the image produce the same masks as before. (#2793)import supervision as sv # one item: {"box_2d": [500, 500, 1001, 1001], "label": "cat", "mask": "data:image/png;base64,..."} detections = sv.Detections.from_vlm( sv.VLM.GOOGLE_GEMINI_3_5, result, resolution_wh=(1000, 800) ) detections.mask.shape, int(detections.mask.sum()) # ((1, 800, 1000), 200000) # 0.31.1: ValueError: could not broadcast input array from shape (400,501) into shape (400,500)Crop and icon annotators on grayscale scenes
CropAnnotatorandIconAnnotatorused to raiseIndexErrororValueErroron scenes shaped(H, W)or(H, W, 1), or given as a Pillow"L"image. Crops now keep the scene's channel layout, and icons are drawn as their gray luminance, blended by their alpha channel. (#2788)import numpy as np import supervision as sv scene = np.zeros((100, 100), dtype=np.uint8) scene[20:60, 20:60] = 200 detections = sv.Detections( xyxy=np.array([[20, 20, 60, 60]], dtype=float), class_id=np.array([0]) ) sv.CropAnnotator().annotate(scene.copy(), detections).shape # (100, 100) (0.31.1: IndexError: tuple index out of range)Half-precision boxes that stay finite
sv.scale_boxesandDetections.get_anchors_coordinatesnow compute box centers without overflowingfloat16: a box from 40000 to 60000 used to report aninfcenter.DetectionsSmootheralso compares oriented-box corner distances infloat64, which stopsfloat16and narrow integer coordinates from overflowing; integer coordinates beyond2**53still lose low-order pixels in thefloat64average. (#2787, #2785)import numpy as np import supervision as sv detections = sv.Detections( xyxy=np.array([[40000, 40000, 60000, 60000]], dtype=np.float16) ) detections.get_anchors_coordinates(sv.Position.CENTER).tolist() # [[49984.0, 49984.0]] (0.31.1: [[inf, inf]])🔄 Migration guide
One behavior change needs your attention: the Pascal VOC box convention. No public symbol was added, renamed or removed in this release, and nothing is deprecated.
Pascal VOC
<bndbox>indices affectssv.DetectionDataset.as_pascal_vocandsv.DetectionDataset.from_pascal_voc. Before 0.31.2, export added 1 to all four corners of a box-only object and truncated, and import subtracted 1 from all four. From 0.31.2, both follow the devkit's 1-based, inclusive indices: onlyxminandyminare shifted by one, and export rounds to the nearest pixel. Export rounds every corner to a whole pixel and the loader returnsfloat32coordinates, so check precision-sensitive boxes after a round trip. Files from different versions don't round-trip. (#2748, #2780)Box
[10, 20, 40, 60]| Written<bndbox>| Read back by 0.31.2
---|---|---
written by 0.31.1 |xmin=11 ymin=21 xmax=41 ymax=61|[10, 20, 41, 61]
written by 0.31.2 |xmin=11 ymin=21 xmax=40 ymax=60|[10, 20, 40, 60]- Box-only objects (no
<polygon>) in files written by 0.31.1 or earlier now load one pixel larger on the right and bottom edges. To restore the original boxes, subtract 1 from<xmax>and<ymax>of those objects only, or re-export the dataset from its source with 0.31.2. Objects exported from masks, which carry a<polygon>, already used the devkit maxima, so leave their files alone: their masks load as before, while their boxes now end one pixel further right and down. - Files exported by 0.31.2 match what Detectron2 and other devkit readers expect, so workarounds for the old extra +1 in
xmaxandymaxcan go.
📝 Notable changes
⚠️ Breaking Changes
- Pascal VOC box extents —
as_pascal_vocandfrom_pascal_vocfollow the devkit's 1-based, inclusive<bndbox>indices and export rounds corners to the nearest pixel. Box-only objects written by earlier versions load one pixel larger on the right and bottom edges, so check the migration guide before reading old VOC datasets. (#2748, #2780)
🔧 Fixed
Datasets and file I/O
- Dataset exports finished without an error even when an image could not be written, leaving image files missing; detection dataset exports and
ClassificationDataset.as_folder_structurenow raiseOSErrorwith the destination path. (#2772) JSONSink.write_and_close()raisedValueError: I/O operation on closed file.when called inside awithblock, because the block's exit calls it again; it's now a no-op once the file is closed, likeCSVSink.close(). (#2771)JSONSink.appendkept references to its input, so reusing NumPy buffers or editing nested metadata changed rows that were already appended; it now snapshots the data. (#2781)- NumPy boolean scalars are now written as JSON booleans in JSON files. (#2783)
Detections and VLM
Detections.from_vlmwith the Gemini 2.5 and 3.5 connectors failed on any item whosebox_2dleft the 0-1000 range; its mask is now cropped to the image. (#2793)Detections.select()raised an indexing error on selected rows that share a scalar value indata; scalar NumPy values are now preserved. (#2769)sv.mask_iou_batchnow treatsCompactMaskinputs like dense masks: mismatched image shapes raiseValueError, unsupported overlap metrics are rejected even when bounding-box pre-filtering finds no pair, and exact NMS thresholds make the same decision for both. (#2767)sv.scale_boxesandDetections.get_anchors_coordinatesoverflowed toinfforfloat16boxes with large coordinates. (#2787)DetectionsSmoothercould overflow or tie onfloat16and large integer coordinates when aligning oriented-box corners; integer coordinates beyond2**53still lose low-order pixels in thefloat64average. (#2785)
Annotators and video
CropAnnotatorandIconAnnotatorraisedIndexErrororValueErroron grayscale scenes. (#2788)get_video_frames_generatorleft its video capture open when range validation or the initial seek failed; it now releases the capture and logs any secondary release error without replacing the original error. (#2782)
🏆 Contributors
Welcome to our first-time contributors: 卢文彬, SHLOK SINGH, zurrll, Huashuo Lei, moyunliuyin, Wentao Tong and LEE, WEI-HONG!
- Avanish Garg (@avanish-garg) — kept Gemini 2.5 and 3.5 masks when a box leaves the 0-1000 range.
- Mohammad Hijjawi (@MohammadHijjawi97) — made
CropAnnotatorandIconAnnotatorwork on grayscale scenes. - 卢文彬 (@lu123bing) — fixed
infbox centers for half-precision boxes. - A Aswanth Raj (@aswanth-07) — fixed overflow in
DetectionsSmoothercorner alignment. - Kaushik Reddy Lingireddy (@Lingikaushikreddy) — rounded Pascal VOC corners instead of truncating them.
- moyunliuyin (@moyunliuyin) — aligned Pascal VOC export and import with the devkit's box extents.
- Junghwan (@shaun0927) — fixed
JSONSink.appendbuffer reuse and released video captures when setup fails. - Huashuo Lei (@wpyaoxueros) — fixed
Detections.select()with scalar data. - Wentao Tong (@tongwentao) — made dataset exports raise when an image cannot be written.
- kevin (@kevin9327) — fixed
JSONSink.write_and_close()after the file is closed. - Devulapalli Naga Sri Vaishnavi (@Vaishnavi220506) — aligned
CompactMaskIoU with the dense-mask contract. - @zurrll — saved NumPy booleans as JSON booleans.
- SHLOK SINGH (@buildwithshlok) — added type checking to the annotators tests.
- LEE, WEI-HONG (@AuricTW) — added a
cross_productdoctest. - Jirka Borovec (@Borda) — prepared the release.
Automated contributions: Dependabot, Copilot, Claude, pre-commit.ci
Full changelog :
0.31.1...0.31.2 -
🔗 r/LocalLLaMA The RTX 5090 Isn't Gone, It's In Chinese Labs, Where Technicians Rip Off Its Die And 32GB VRAM For AI Servers rss
 | submitted by /u/chemist_slime
[link] [comments]
---|--- -
🔗 OmniNull/OmniWM Canary 20261024-0439 (2f49ed7c) release
Automated canary build of
main. It is signed and notarized like a release but skips the owner review, so treat it as unstable.See the canary guide to install, update, or return to stable. For everyday use, download the latest stable release.
- Commit:
2f49ed7c3a03 - Base tag:
canary-20261023-0937-39929994137-1
Changes since canary-20261023-0937-39929994137-1
2f49ed7Merge pull request #975 from dappermint/feat/hidden-bar-inline-itemsf35618eMerge pull request #971 from hezhizhen/codex/input-source-regression-tests665c864feat(hidden-bar): show hidden items inline in the bar36bcd78Merge pull request #974 from OmniNull/dependabot/npm_and_yarn/website/npm_and_yarn-9cae7cad90736ffbftest(shell): await queued input source refresh after stopping2404244build(deps): bump astrode43c42Merge pull request #972 from hezhizhen/codex/localize-shell-choice-labels94cef1bMerge pull request #973 from dappermint/fix/shell-timed-render-pacingb9f4ed4test(shell): cover deferred input source refreshes49e30e5fix(shell): pace timed renders by the feed secondsc2048b6fix(shell): localize built-in choice labels9a41498Merge pull request #968 from hezhizhen/codex/localize-shell-option-titlesd44316cMerge PR #970: Read the input source after the change notification2c07492fix(shell): skip a queued input source read after listening stops2d1bd27fix(shell): read the input source after the change notification8f5e27bClose the TOML example in the components configuration guidec7533ceMerge PR #966: Scroll in batches the surface can keep up with7e92c8eMerge PR #964: Pin the remaining actions to commit SHAsf7a3d48test(shell): simplify option title localization coverage9bd82c5fix(shell): localize built-in widget option titles9cf93a6Merge PR #962: Make root scripts declare HTTP hosts and allow plain HTTP only on loopback4cf64cftest(shell): scroll in batches the surface can keep up with9435b2eci: drop the stored checkout token in website and scope greetings permissions99d2f28docs(shell): put the root capabilities key above the option tablesfff3f78ci: pin the remaining actions to commit shas86572bffix(shell): make root scripts declare http hosts and allow plain http only on loopback
- Commit:
-
🔗 smol-machines/smolvm smolvm v1.32.1 release
What's Changed
- chore(nix): bump flake to 1.32.0 by @github-actions[bot] in #1972
- Let a pause pin later layers after one cannot be linked, instead of failing to create the pin directory again. by @BinSquare in #1973
Full Changelog :
v1.32.0...v1.32.1 -
🔗 r/LocalLLaMA Qwen4-27B PR found rss
PR: https://github.com/analytics-zoo/vllm-xpu-kernels/pull/22
The PR author seems to have contributed to intel repos a lot and VLLM. He also shares his name (might be the same person?) with a person who is either a CTO somewhere at alibaba or the Director of Zhejiang Lab.
He has worked on Qwen3.8 before this.
The PR also implies the KV cache size for Qwen4-27B is not decreasing.
submitted by /u/brainExploded99
[link] [comments] -
🔗 smol-machines/smolvm smolvm v1.32.0 release
What's Changed
- chore(nix): bump flake to 1.31.5 by @github-actions[bot] in #1964
- Add dispatch programs that run Amp's self-hosted orbs as smol machines, on your own host or on smol cloud by @BinSquare in #1948
- Bump libkrun to f9c80369 so branches and restores of nested-virtualization machines keep their KVM nested state. by @BinSquare in #1961
- Mount and unmount host directories on a running machine without a restart by @BinSquare in #1963
- Bump libkrun to 93b8d977 so a directory mounted again serves the files the guest already looked up by @BinSquare in #1968
- Never resolve a restored checkpoint's credential bindings from this host's environment by @BinSquare in #1966
- Attach a --disk in the format it had when attached, so a guest cannot turn it into a qcow2 image backed by a host file by @BinSquare in #1967
- Bump libkrun to 6d17e582 so a macOS guest cannot hard-link a symlink into a host file by @BinSquare in #1969
- Refuse to attach a directory that overlaps one already attached, naming the guest path that holds it by @BinSquare in #1970
- Bump smolvm to 1.32.0 by @BinSquare in #1971
Full Changelog :
v1.31.5...v1.32.0 -
🔗 HexRaysSA/plugin-repository commits sync repo: +7 releases, -5 releases rss
sync repo: +7 releases, -5 releases ## New releases - [ida-bochs-binaries](https://github.com/hexrayssa/ida-bochs-binaries): 2.0.1, 1.0.6 - [ida-mcp](https://github.com/hexrayssa/ida-mcp): 20261023.0.2, 20261023.0.1, 20261022.0.1 - [ida-nexus](https://github.com/hexrayssa/ida-nexus): 0.14.1, 0.14.0 ## Changes - [ida-mcp](https://github.com/hexrayssa/ida-mcp): - removed version(s): 0.9.0, 0.10.1, 0.10.0 - [ida-nexus](https://github.com/hexrayssa/ida-nexus): - removed version(s): 0.8.1, 0.8.0 -
🔗 backnotprop/plannotator v0.28.30 release
Follow @plannotator on X for updates
Missed recent releases? Release | Highlights
---|---
v0.28.29 | Plan review opens on OpenCode 2, a DOMPurify security update, closing a review stops the agent everywhere
v0.28.27 | Jump to open questions, files side by side or full screen, image zoom in the Inbox, empty To field, text size for plan review and annotate
v0.28.26 | Action items and reply drafts in the Inbox, one decision button for plan review, Enter to save a comment, a custom code font
v0.28.25 | Re-ask open questions, delivery ticks on the list, a count of new messages on the tab, right-click a thread, click Inbox to refresh
v0.28.24 | A new look for the Inbox, Send now, tag agents, comment on an agent's message, much smaller reads for agents, links in HTML pages
v0.28.23 | Inbox replies reach sessions with background subagents, dictated text no longer goes missing, 👍 Looks good reaches the agent, notifications that never fail silently
v0.28.22 | 👍 Looks good, full view for files, one viewer for a thread's images and files, every session prints its URL,PLANNOTATOR_BROWSER=noneopens nothing
v0.28.21 | Message an agent from the Inbox, video attachments, Open in for attachments, Code / Tests / Generated in code review, writes from other websites refused
v0.28.20 | Inbox search (⌘K), real folder names for projects, data files open in the code view, word-only replies leave questions open
v0.28.19 | Ask this session in T3 Code, folder sessions load shared stylesheets and images, the agent note asked once per agent, Copy connect prompt
v0.28.18 |plannotator inboxconnects your agents, agents are told when to use the Inbox, rendered Markdown in code review, Inbox Settings in sections
v0.28.17 | The Inbox on iPads and narrow windows, the reply bar no longer cuts off "Keep open", a Pi crash on/reloadfixedWhat's New in v0.28.30
An Artifacts view in the Inbox, comments on part of an image, diagrams in code review, and Ask AI that keeps its conversation across documents in annotate. 9 PRs, one from a first-time contributor, @mvanhorn.
Plannotator Inbox
Artifacts
A thread's header has an Artifacts button that shows every file, image and guided review in the thread as one grid, newest first. A tile opens the file in the viewer beside the grid, and stepping in the viewer keeps thread order.
Split or Unified diffs in guided reviews
A guided review in the Inbox has a Split | Unified tab on its first file. The choice applies to every file in the review. Phones always show one column.
Re-ask from the open-questions list
Re-ask moved into the "N open questions" list and now works for a single question too.
Smaller changes
- Action items use the thread's text size , so the card no longer looks larger than the messages and question cards around it. #2123
Plannotator
Comment on part of an image
In annotate and plan review, open an image from the document, switch to Region and drag a box to comment on that part of it. The agent gets the image, its line in the file, the box in the image's own pixels, and your comment.
Diagrams in code review
Mermaid and Graphviz diagrams in a Markdown file's Read and Changes views are now drawn, and so is the diagram in a guide overview. The diagram engine loads only when a review has one, so a review without diagrams loads nothing extra.
Ask AI keeps its conversation in annotate
Moving between files in a folder session, opening a linked document, or going back no longer clears the Ask AI conversation. Each question still carries the document it was asked about.
Smaller changes
- Updates are checked about once an hour instead of once a day, so a new release shows up sooner. It is still one small request at most per hour. #2112
- The update toast says what Update does : it installs in the background and the review keeps working. #2106
Install / Update
macOS / Linux:
curl -fsSL https://plannotator.ai/install.sh | bashWindows:
irm https://plannotator.ai/install.ps1 | iexClaude Code Plugin: The plugin and the
plannotatorbinary update separately, so run the install script above as well. In a terminal:claude plugin marketplace update plannotator claude plugin update plannotator@plannotatorThen restart Claude Code. Inside Claude Code, run
/plugin marketplace update
plannotator
, then open/plugin→ Installed → plannotator → Update now.Pi:
pi update --extensionsOpenCode: Re-run the install script above. It now also clears the OpenCode 2 plugin cache.
What's Changed
- Inbox: Artifacts view for a thread by @backnotprop in #2122
- Inbox: action items at the thread's text size by @backnotprop in #2123
- Comment on part of an image by @backnotprop in #2117
- feat: preserve Ask AI chat across annotate document navigation by @mvanhorn in #2103
- Inbox: Split | Unified tab in guided reviews by @backnotprop in #2119
- Inbox: Re-ask from the open-questions list, and for one question by @backnotprop in #2113
- Update toast: say what Update does by @backnotprop in #2106
- Check for updates hourly instead of daily by @backnotprop in #2112
- Code review: draw diagrams, loaded only when needed by @backnotprop in #2110
New Contributors
Community
- @mvanhorn: kept the Ask AI conversation across annotate navigation (#2103)
- @zane668: asked for comments on part of an image and for Ask AI to keep its history in folder sessions (#2100, #1001)
- @kshurukhin: asked for unified diffs in the Inbox (#2107)
- @barreiroleo: asked for Mermaid diagrams in code review (#2096)
Full Changelog :
v0.28.29...v0.28.30 -
🔗 Andrew Healey's Blog Decompiling Fast Food Tycoon 2: Drawing the World rss
How a 2001 business sim rendered its rich and detailed cities.
-
- October 23, 2026
-
🔗 IDA Plugin Updates IDA Plugin Updates on 2026-10-23 rss
-
🔗 anthropics/claude-code v2.1.310 release
What's changed
- Added the Monitor tool and plugin monitors on Bedrock, Vertex, and Foundry, and when telemetry or nonessential traffic is disabled; long foreground sleeps are now blocked there too
- Fixed requests failing behind some gateways and compatible servers that reject the
effort-2025-11-24beta value or mid-conversation system messages; Claude Code now retries without them - Fixed background cleanup deleting some recent files, such as pasted images, when
cleanupPeriodDaysis set to a very large value - Fixed compaction after a "Prompt is too long" error keeping too much of a conversation with dense text, such as base64 or SVG, so the next request could fail again
- Fixed file read permission prompts not showing where a symbolic link leads
- Fixed a question's auto-continue timeout firing the moment the external editor closed after a long edit
- Windows: Fixed PreToolUse and PermissionRequest hooks letting a tool call through when Git Bash is missing and the hook's command is only quoted strings, such as a quoted path
- Improved auto mode's prompt before the first read outside the working directories: it now says when blocking those reads makes shell commands ask for permission
- Improved memory use of non-interactive sessions (
-p, Agent SDK) during compaction when the transcript file is very large - Improved a mod's
Imageto draw inside tmux withallow-passthroughandfocus-eventson, in kitty, Ghostty, and iTerm2 3.5+ with fullscreen rendering, where it showed only itsalttext - Linux: Improved
/sandboxand the sandbox startup warning to name Ubuntu's AppArmor restriction on user namespaces, and how to lift it, when it keeps bubblewrap from starting the sandbox - Changed the error for an MCP tool call that times out in a non-interactive session while the server's elicitation is unanswered: it now tells Claude that no answer came and not to repeat the call
- [VSCode] Fixed pressing Enter on the plan review card's "Send feedback and keep planning" button approving the plan instead of sending your comments back
- [VSCode] Fixed the panel showing "Something went wrong" after "Switch branch & continue" on a cloud session opened from Session history's Web tab
- [Cloud sessions] Added Claude Code cloud sessions and Remote Control permissions to Enterprise custom roles, so Owners can control access to each by role
- [Cloud sessions] Added a Choose file button to load a cloud environment's setup script from a file
- [Cloud sessions] Fixed failed saves and archives in the cloud environment edit dialog showing no error inside the dialog
- [Cloud sessions] Fixed failed routine API token actions showing only a toast; the error now appears in the routine edit dialog
- [Cloud sessions] Improved the session start checklist to show a cloud environment's setup script output in a scrolling box
- [Cloud sessions] Changed turning on Cloud sessions or Remote Control in admin settings to ask for confirmation and list the custom roles that have that permission
- [Cloud sessions] Changed the cloud environment dialog to open network access, setup script and environment variables from rows instead of listing every editor at once
- [Claude Tag] Fixed Claude Tag treating
!commands such as!restartand!helpas ordinary messages when sent in bold, italic or strikethrough - [Claude Tag] Fixed Claude Tag admin channel and workspace pages being replaced by a load error when a background refresh of the bundle list fails
- [Claude Tag] Fixed Claude Tag's spend limits page in admin settings reporting that no channels match a filter while channel names are still loading
- [Code Review] Fixed the Code Review admin section hiding its repositories and switches after a failed refresh of the repository list
- [Code Review] Improved the Code Review admin section to retry the first load and show one Try again banner when it still fails
-
🔗 smol-machines/smolvm smolvm v1.31.5 release
What's Changed
- Compare a branch source's VM binary with the one this engine boots VMs with, so embedding SDKs can branch again by @BinSquare in #1959
- Stage the file a symlinked --image archive points at, so the guest can read it by @BinSquare in #1958
- chore(nix): bump flake to 1.31.4 by @github-actions[bot] in #1957
- Rename Licenses.md to THIRD-PARTY-NOTICES.md so GitHub detects the Apache-2.0 license by @BinSquare in #1960
- Bump smolvm to 1.31.5 by @BinSquare in #1962
Full Changelog :
v1.31.4...v1.31.5 -
🔗 exe.dev Hunting Bugs? Look at Commits rss
If you’re looking for bugs, you’ll get better results if you focus the agents’ attention.
The usual loop is roughly:
for f in files:
  "please look for important bugs, using $f as a starting point"
But I've found this to be more effective:
for c in commits: "please analyze $c for important bugs; validate that they still exist at HEAD" -
🔗 r/LocalLLaMA Here's where the last RTX 5090 cards are going: Massive AI conversion factory exposed in China, Founders Edition included rss
 | submitted by /u/fallingdowndizzyvr
[link] [comments]
---|--- -
🔗 r/LocalLLaMA Vibecoding your own inference engine is easy they said rss
 | guys, you better just clone llama.cpp I swear.
this thing is running gguf q4 paged into webgl2 embedded compute buffers via glsl right inside html, and tokenizer/vocab is just part of the endless debug hell. submitted by /u/CodeMichaelD
[link] [comments]
---|--- -
🔗 backnotprop/plannotator v0.28.29 release
Follow @plannotator on X for updates
Missed recent releases? Release | Highlights
---|---
v0.28.27 | Jump to open questions, files side by side or full screen, image zoom in the Inbox, empty To field, text size for plan review and annotate
v0.28.26 | Action items and reply drafts in the Inbox, one decision button for plan review, Enter to save a comment, a custom code font
v0.28.25 | Re-ask open questions, delivery ticks on the list, a count of new messages on the tab, right-click a thread, click Inbox to refresh
v0.28.24 | A new look for the Inbox, Send now, tag agents, comment on an agent's message, much smaller reads for agents, links in HTML pages
v0.28.23 | Inbox replies reach sessions with background subagents, dictated text no longer goes missing, 👍 Looks good reaches the agent, notifications that never fail silently
v0.28.22 | 👍 Looks good, full view for files, one viewer for a thread's images and files, every session prints its URL,PLANNOTATOR_BROWSER=noneopens nothing
v0.28.21 | Message an agent from the Inbox, video attachments, Open in for attachments, Code / Tests / Generated in code review, writes from other websites refused
v0.28.20 | Inbox search (⌘K), real folder names for projects, data files open in the code view, word-only replies leave questions open
v0.28.19 | Ask this session in T3 Code, folder sessions load shared stylesheets and images, the agent note asked once per agent, Copy connect prompt
v0.28.18 |plannotator inboxconnects your agents, agents are told when to use the Inbox, rendered Markdown in code review, Inbox Settings in sections
v0.28.17 | The Inbox on iPads and narrow windows, the reply bar no longer cuts off "Keep open", a Pi crash on/reloadfixed
v0.28.16 | The Inbox on a phone, a doorbell for new questions, Mark read, step through a thread's files, replies when the asking session endedWhat's New in v0.28.29
A patch release: plan review now opens on OpenCode 2, a DOMPurify security update, and two skill fixes. (v0.28.28 was never published; its release was stopped by the security check this update fixes.)
Plannotator
Plan review works on OpenCode 2
On OpenCode 2, the plan agent wrote its plan into the chat and never sent it for review. OpenCode 2 adds its own Plan mode note telling the model to discuss the plan in the conversation, and Plannotator didn't recognize that wording. Plannotator now replaces the note, so the plan agent calls
submit_planand the review opens. Tested on OpenCode 2.0.19 and 2.1.2. OpenCode 1 is unchanged.Smaller changes
- Closing a review without feedback stops the agent on every agent, not only Claude Code. Closing is not approval. #2099, closing #2097
- The visual-explainer skill asks before installing its third-party dependency. #2099, closing #2098
- DOMPurify 3.4.17 fixes a critical sanitizer advisory (GHSA-cg2g-xh64-v4q7). Mermaid's copy is updated too. #2104
- Guided Reviews can carry an overview with an optional diagram (guide format version 2). Nothing creates one yet; this is groundwork. Existing guides are unchanged. #2095
Install / Update
macOS / Linux:
curl -fsSL https://plannotator.ai/install.sh | bashWindows:
irm https://plannotator.ai/install.ps1 | iexClaude Code Plugin: The plugin and the
plannotatorbinary update separately, so run the install script above as well. In a terminal:claude plugin marketplace update plannotator claude plugin update plannotator@plannotatorThen restart Claude Code. Inside Claude Code, run
/plugin marketplace update
plannotator
, then open/plugin→ Installed → plannotator → Update now.Pi:
pi update --extensionsOpenCode: Re-run the install script above. It now also clears the OpenCode 2 plugin cache.
What's Changed
- Guide builder and overview (guide format v2) by @backnotprop in #2095
- Skills: a closed session stops; ask before installing visual-explainer by @backnotprop in #2099
- OpenCode 2: recognize the new Plan mode reminder so submit_plan runs by @backnotprop in #2102
- deps: DOMPurify 3.4.17 (GHSA-cg2g-xh64-v4q7) by @backnotprop in #2104
Community
- @Duo-Huang: found and traced plan review not opening on OpenCode 2 (#2101)
- @zane668: the closed-session and visual-explainer skill issues (#2097, #2098)
Full Changelog :
v0.28.27...v0.28.29 -
🔗 r/LocalLLaMA everything will be local eventually rss
I know current llms like opus 5.5 are in a league of their own. but we all know they're losing a shti ton of money with their subscriptions. ALSO we all know how tasks like OCR, segmentation etc are getting solved by single digit B parameter models. I'm not saying llms are a gimmick but I'm saying the future is already shaping up to be about specialized models that work better when they're smaller. easier training. so datacenter level power not needed. ten years from now we'll have a specialized model for the tasks we care about and llms will fail to do everything all at once (unless they keep calling it one model but have a hundred under the hood).
system one models are a bad but workable example. you could tell an llm to rate options all day but get yourself on 9B parameter model trained by some lab and it tops the benchmarks.
submitted by /u/YogurtExternal7923
[link] [comments] -
🔗 backnotprop/plannotator v0.28.28 release
chore: bump version to 0.28.28
-
🔗 OmniNull/OmniWM Canary 20261023-0937 (28ded16c) release
Automated canary build of
main. It is signed and notarized like a release but skips the owner review, so treat it as unstable.See the canary guide to install, update, or return to stable. For everyday use, download the latest stable release.
- Commit:
28ded16c88ef - Base tag:
canary-20261022-0439-39721295344-1
Changes since canary-20261022-0439-39721295344-1
28ded16Merge pull request #959 from dappermint/fix/toolchain-cache-recovery810a195ci: start from a clean toolchain when its cache restore fails0e0bf3cMerge PR #958: Add Fluxer community chat links9f35cdfdocs: add fluxer community chat links4450248Update SwiftFormat to 0.64.19bfd535Merge pull request #921 from dappermint/test/qa-suite-hardening4eba57fstyle(hidden-bar): drop the trailing comma swiftformat 0.63 rejects931a291Merge pull request #957 from hezhizhen/codex/fix-hidden-native-cross-displayc532780test(hidden-bar): stop depending on the finder extension settingba39913test(shell): give bundled widget renders a 1 s cpu budget2b4cf58test(shell): wait for the bar before counting its widgets18427datest(support): let until name the condition it waited for958bbfdfix: discard deferred native moves for hidden windows22b8f6cTranslate the new swipe-edge and cross-display drag settings92ca342Merge pull request #952 from brdoney/swipe-edge-behaviorb7b10ddMerge pull request #933 from hezhizhen/codex/native-titlebar-cross-display47d8df0Merge pull request #949 from brdoney/fill-left-reserve-space6b608a4Merge pull request #956 from brdoney/fix-nil-layer-borderdc5117eMerge pull request #951 from hezhizhen/codex/fix-notification-api-referencea89d802fix(shell): draw no border when a widget sets a width without a colordafebd0Update fill-left reserve docs and reuse the overlapping casec24495eAdd configurable workspace swipe behavior at the edges56dd4a4fix(docs): include notification types in the Luau referencebc403f5fix: retain deferred native drag correction obligations44459e7fix: ignore managed frames during native cross-display adoptionf71c0a6feat: opt in to native title-bar moves across displays9fc6374Merge pull request #940 from hezhizhen/codex/fix-wallpaper-region-crop672f8ffReserve workspace bar space in Fill Left of Notch modecf3599eMerge PR #945: Check widget option declarations and add Nocturne options97b8aaatest(shell): match whole option names in the declaration checkefb89c7fix: crop full-window wallpaper captures before region fallback80dca94feat(shell): declare scratchpad, calendar and weather options for nocturne37f7889test(shell): check bundled widgets declare the options they readf8cddb7Merge pull request #941 from dappermint/fix/touch-count-provider-rewrapddc5e5cMerge origin/main while preserving notification support10455b5Merge pull request #943 from rickythefox/feat/942-focus-rankd61a7d3Dismiss notifications through their native Close actionbacd0e5Add native notification actions and capture diagnostics2ebfb50feat(ipc): expose window focus history via query windows0aa1470Match Notifications to OmniShell styles4953efeAdd retained notifications to OmniShell31d4e80fix(input): stop the touch count provider growing on every read
- Commit:
-
🔗 r/LocalLLaMA Models disappearing from Huggingface rss
 | I've been noticing a lot of my downloads stopping suddenly and being unable to resume. When I checked the models it seemed like they were gone. Here's the ones I can see are missing:
- dealignai/MiMo-V2.6-Pro-RL-UNCENSORED
- audnai/penclaw-GLM-5.3-abliterated-for-offensive-cyber
- huihui-ai/Huihui-Kimi-K2.7-Code-abliterated-GGUF
and somehow not a single Alliterated Deepseek-R1. Does anyone know what's going on and where else the vanished models might be found? submitted by /u/umarmnaq
[link] [comments]
---|--- -
🔗 smol-machines/smolvm smolvm v1.31.4 release
What's Changed
- chore(nix): bump flake to 1.31.3 by @github-actions[bot] in #1949
- Boot a pack prepared on a machine's storage from that storage instead of its source image's archive, and keep .wh. files in a pack's only layer by @BinSquare in #1950
- Refuse to branch a source still running the engine from before an upgrade by @BinSquare in #1952
- Keep agent unit tests off the storage disk of the machine they run on by @BinSquare in #1955
- Grow RAM live on CLI-started machines when no cgroup limit is in the way by @BinSquare in #1956
- Bump smolvm to 1.31.4 by @BinSquare in #1954
Full Changelog :
v1.31.3...v1.31.4 -
🔗 r/LocalLLaMA MiniMax-M3.1-Flash rss
-
🔗 backnotprop/plannotator v0.28.27 release
Follow @plannotator on X for updates
Missed recent releases? Release | Highlights
---|---
v0.28.26 | Action items and reply drafts in the Inbox, one decision button for plan review, Enter to save a comment, a custom code font
v0.28.25 | Re-ask open questions, delivery ticks on the list, a count of new messages on the tab, right-click a thread, click Inbox to refresh
v0.28.24 | A new look for the Inbox, Send now, tag agents, comment on an agent's message, much smaller reads for agents, links in HTML pages
v0.28.23 | Inbox replies reach sessions with background subagents, dictated text no longer goes missing, 👍 Looks good reaches the agent, notifications that never fail silently
v0.28.22 | 👍 Looks good, full view for files, one viewer for a thread's images and files, every session prints its URL,PLANNOTATOR_BROWSER=noneopens nothing
v0.28.21 | Message an agent from the Inbox, video attachments, Open in for attachments, Code / Tests / Generated in code review, writes from other websites refused
v0.28.20 | Inbox search (⌘K), real folder names for projects, data files open in the code view, word-only replies leave questions open
v0.28.19 | Ask this session in T3 Code, folder sessions load shared stylesheets and images, the agent note asked once per agent, Copy connect prompt
v0.28.18 |plannotator inboxconnects your agents, agents are told when to use the Inbox, rendered Markdown in code review, Inbox Settings in sections
v0.28.17 | The Inbox on iPads and narrow windows, the reply bar no longer cuts off "Keep open", a Pi crash on/reloadfixed
v0.28.16 | The Inbox on a phone, a doorbell for new questions, Mark read, step through a thread's files, replies when the asking session ended
v0.28.15 | Long Inbox threads fold to what is new, "Skipped N questions" replies, Inbox list and sidebar fixesWhat's New in v0.28.27
A jump list for a thread's open questions, files side by side or full screen, image zoom everywhere, text size for plan review and annotate, and a run of fixes from your reports.
Plannotator Inbox
Jump to open questions
When a thread has questions you haven't answered, a button in its foot says how many. It lists them, and choosing one opens its message and takes you to the card.
Side by side or full screen, remembered
An open file has a Side by side | Full screen switch in its header. The Inbox remembers the one you picked.
Zoom and pan images
Images in the Inbox zoom with a trackpad pinch or Ctrl/⌘ + wheel, pan by dragging, and switch between Fit and 2× on a double-click. ← → still step to the next file while zoomed, and a comment's drawing stays on the image at any zoom.
Action items as a checklist
An agent's action items show as one checklist card: tick each off, open it for the details, and see "2 of 3 done" at a glance.
Smaller changes
- New messages start with To empty , so a message can't go to the wrong agent. The last agent you used is listed first. #2089
- Attached files always show in the Clean look. #2092
- A thread's draft status sits to the right of its buttons. #2083
- Agent icons come in one set of sizes , and tooltips are borderless and quicker to appear. #2078, #2079
- Phone sheets have rounder top corners. #2076
Plannotator
Text size
Settings → Display → Text size makes plan review and annotate text smaller or larger.
Zoom images
The image viewer zooms with the mouse wheel or a pinch and pans by dragging. Actual size now really shows the image at its own size.
Smaller changes
- The tab title and header name the open file in annotate. #2075, closing #2061
- Comment Edit and Delete buttons show on screens without hover (Chrome on some Linux setups, touch screens). #2065, closing #2062
- HTML pages you annotate can open alert, confirm and prompt dialogs. #2071, closing #2063
- Mermaid labels in Chinese, Japanese and Korean no longer wrap their last character onto a new line. #2072, closing #2064
- Ask AI answers show tables. #2070, closing #2069
- Back from a linked document returns to where you were reading. #2084, closing #2082
- Links with an underscore are linked in full , not cut off at the first
_. #2088 - Pi and Oh My Pi: after updating Plannotator while Pi is running, you're now told to restart, instead of seeing a confusing error. #2087, closing #2085
Install / Update
macOS / Linux:
curl -fsSL https://plannotator.ai/install.sh | bashWindows:
irm https://plannotator.ai/install.ps1 | iexClaude Code Plugin: The plugin and the
plannotatorbinary update separately, so run the install script above as well. In a terminal:claude plugin marketplace update plannotator claude plugin update plannotator@plannotatorThen restart Claude Code. Inside Claude Code, run
/plugin marketplace update
plannotator
, then open/plugin→ Installed → plannotator → Update now.Pi:
pi update --extensionsOpenCode: Re-run the install script above. It now also clears the OpenCode 2 plugin cache.
What's Changed
- Show comment actions on devices without hover by @backnotprop in #2065
- Show images at their real size in the lightbox by @backnotprop in #2068
- fix(ui): render markdown tables in Ask AI answers by @backnotprop in #2070
- fix(html): let annotated pages open alert, confirm and prompt by @backnotprop in #2071
- fix(ui): wrap Mermaid labels at 140 px by @backnotprop in #2072
- Text size for plan review and annotate by @backnotprop in #2073
- Wheel and pinch zoom in the image lightbox by @backnotprop in #2074
- feat(editor): name the open file in the tab title and the header by @backnotprop in #2075
- Phone sheets: 12 px top corners by @backnotprop in #2076
- Inbox: action items as a checklist by @backnotprop in #2077
- Inbox: agent marks on one size scale by @backnotprop in #2078
- Tooltips: borderless float at 150 ms by @backnotprop in #2079
- Inbox: name the side-by-side view and remember it by @backnotprop in #2080
- Inbox: draft status on the right of the thread's buttons by @backnotprop in #2083
- fix: Back from a linked document keeps the reader's place by @backnotprop in #2084
- test: close the sidebar peek before the toolstrip probe by @backnotprop in #2086
- fix(pi): say to restart when Plannotator was updated under a running host by @backnotprop in #2087
- fix(ui): keep underscores inside bare URL autolinks by @backnotprop in #2088
- feat(inbox): start a new message with To empty by @backnotprop in #2089
- feat(ui): Viewer belowTitle slot for hosts by @backnotprop in #2090
- feat(inbox): open questions button in the thread foot by @backnotprop in #2091
- fix(inbox): attached files always use the Clean look by @backnotprop in #2092
- Zoom and pan in the Inbox image viewer by @backnotprop in #2093
Community
Most of this release came from your reports. Thank you:
- @zane668: the file name in the tab title (#2061), Mermaid labels wrapping in Chinese, Japanese and Korean (#2064), image actual size and zoom (#2067, #2081), and Back losing your place (#2082)
- @ppommer: text size (#2066) and tables in Ask AI (#2069)
- @ralwing: comment buttons on screens without hover (#2062)
- @PassionZale: dialogs in annotated HTML pages (#2063)
- @JasonLandbridge: the error after updating under a running Pi (#2085)
Full Changelog :
v0.28.26...v0.28.27 -
🔗 New Music Releases O.A.R. - Three Tinted Windows rss
O.A.R. - a new release is available:
- 2026-10-23: Three Tinted Windows (Album)
Amazon: Canada | Deutschland | France | United Kingdom | United States
Visit muspy for more information.
-
🔗 New Music Releases Polyphia - BE NOT AFRAID rss
Polyphia - a new release is available:
- 2026-10-23: BE NOT AFRAID (Album)
Amazon: Canada | Deutschland | France | United Kingdom | United States
Visit muspy for more information.
-
- October 22, 2026
-
🔗 IDA Plugin Updates IDA Plugin Updates on 2026-10-22 rss
IDA Plugin Updates on 2026-10-22
Activity:
- binsync
- 901af52d: fix(ui): keep host view focus after Open/New dialog errors; reject em…
- ida-settings
- mcrit-plugin
- 75e83537: Merge pull request #59 from familiary/refactor/core-presentation
- 9ee44127: Merge pull request #58 from familiary/feature/ghidra-plugin
- e351304b: Address the Ghidra review follow-ups: console Reset, bridge compile, …
- d2f040bc: Merge feature/ghidra-plugin into refactor/core-presentation
- 40772287: Fix the Ghidra review findings: CFG colors, rejected labels, spinner …
- 8b2097ce: Escape YARA wildcards for the report's architecture
- 41f28926: Count Block Scope's headline functions like its families and samples
- 770d70f3: Share the match views' logic between the Qt widgets and Ghidra
- a49b6061: Tint Ghidra matches with transient markers, fix the GUI runner deadlock
- binsync
-
🔗 anthropics/claude-code v2.1.309 release
What's changed
- Fixed sandboxed Bash commands on macOS and Linux running the shell's startup files outside the sandbox before each command
- Fixed macOS sandbox
denyWriteglob patterns not applying at a path's real location when the pattern's folder is reached through a symlink - Fixed sandboxed commands and auto-accepted edits being able to modify the MCP config file passed with
--mcp-config - Fixed a disabled MCP server being reconnected by a later permission prompt in print and SDK sessions
- Fixed the Bash permission check trusting a variable set by a command whose redirect can fail to open
- Fixed Bash permission checks not prompting for some compound commands that change directory before running git when the
cdis wrapped or prefixed, as they do for a plaincd - Fixed an
Edit(path)deny rule not blocking a Bash redirect to that path in some commands that also held a subshell - Fixed worktree-isolated sessions accepting some locale-prefixed commands the isolation guard should refuse
- Fixed worktree-isolated sessions on zsh accepting some arithmetic commands that the isolation guard should refuse
- Fixed worktrees and branch checkouts that Claude Code creates so they ignore git replace refs, as its other git operations already do
- Fixed profile store write protection not applying when the config directory is reached through a symlink
- Fixed sessions compacting repeatedly after reading files under a very large nested CLAUDE.md; a nested CLAUDE.md over the size limit now loads only its start
- Fixed ctrl+enter (send now) only queuing a message when pressed before the response had started, and restarting a prompt's hooks while leaving the message queued when pressed while those hooks were running
- Fixed key-bound slash commands running in the shell from
!mode - Fixed ctrl+o not showing messages from other agents and sessions that are still waiting to be delivered; they now appear in full under the transcript, marked as waiting
- Fixed long tool output previews being cut through an emoji, leaving session transcripts that
jqcould not parse - Fixed Read reporting "File does not exist" for PDF page ranges in Linux sandboxes that share the parent's
/proc - Fixed messages from a Claude Desktop-hosted session sometimes being lost when its connection refreshed
- Fixed features missing from Claude Code sessions in the Claude desktop app when the terminal on the same computer was signed in to a different account or organization
- Fixed the
claude remote-controlstatus line showingHEADas the branch for a folder that is not in a git repository - Fixed split-pane agent teammates not inheriting the tool deny and
--toolsrules given on the leader's command line - Fixed sessions renamed with
/renameappearing to other sessions under a generated name after a VS Code window reload or a non-interactive--resume - Fixed the
/rewindlist showing "No code changes" for a turn that changed checkpointed files through/code-review --fix, a subagent or a shell command - Fixed
/privacy-settingsshowing an out-of-date "Help improve our AI models" value; it now also says when the setting can't be fetched - Fixed feedback saying "try again later" when your organization does not accept feedback; it now shows the server's reason and where to report a bug
- Fixed oversized /feedback reports failing instead of being resent without the transcript
- Fixed a skill in an
--add-dirfolder being unreachable when another skill already held its name; it is now offered as<folder>:<name> - Fixed
/verifyand/code-reviewnot finding a nested package's own skill when its files were changed from the shell - Fixed the /claude-api skill saying that
ant beta:worker poll --on-workpasses trace context to the command - Fixed the /claude-api skill's C# tracing setup missing spans from the cloud platform clients
- Fixed the /claude-api skill saying that API spans for requests to Claude Platform on AWS can't join the caller's trace
- Fixed hooks that run in PowerShell not blocking when the hook's program exits with code 2, and on Windows
PreToolUseandPermissionRequesthooks with"shell": "powershell"failing open when Git for Windows isn't installed - Fixed a mod's
turn.stephook that names a model by alias, such ashaiku, failing every request with a model error: the alias now resolves to its model - Fixed plugins and skills synced from claude.ai being removed, sometimes mid-session, after a disk read error
- Fixed artifact publishes and updates being refused for some ordinary pages, such as pages with certain minified scripts or artifacts Claude could not read first
- Fixed Claude asking for permission on each artifact update for the rest of a turn after the conversation was compacted in that turn
- Fixed fine-grained tool streaming staying off on Amazon Bedrock when
ANTHROPIC_BEDROCK_BASE_URLis set to the defaultbedrock-runtime.<region>.amazonaws.comendpoint - Fixed the "Waiting for API response" hint flickering behind gateways that send only keepalive pings: routes off Anthropic's backend now wait 45 seconds
- Fixed Claude notifying unrelated GitHub users by writing role names and placeholders as mentions in PRs, issues and comments
- Linux: Fixed sandbox write denies lifting when a background command outlived the session
- Windows: Fixed PowerShell permission checks auto-approving some
Set-Locationorcdcommands that target the current directory and carry extra arguments; these now prompt for approval - macOS: Fixed the "Install Command Line Developer Tools" dialog opening each time Claude Code starts on a Mac without Xcode or the Command Line Tools
- Self-hosted runner: Fixed
--startup-timeout-minstopping a session whose first prompt, such as/code-review, was still working in a subagent; a frozen process is still stopped - Improved the speed of many git commands Claude Code runs for itself on Windows; on every platform, errors from those commands now show in English even when git is set to another language
- Improved the error when a hooks module is nested too deep to load: it now names the file instead of showing a bare stack-overflow message
- Improved disk-full handling: a Bash command cut off by a full disk now says so and names the folder to free up, and starting on a full temp volume prints a clear message, not a raw ENOSPC error
- Improved the /claude-api skill to offer API tracing alongside SDK tracing when asked to add OpenTelemetry
- Improved the /claude-api skill to check the live docs before saying a feature is unsupported
- Self-hosted runner: Improved sessions that move to a new runner: Claude now sees the tool call that was interrupted, marked as outcome unknown
- Updated the bundled dataviz skill to accept APCA as a text-contrast measure (keeping WCAG 2 ratios where AA conformance is required), add an
apca(text, background)function to its palette validator scripts, and say whether a label inside a colored chart fill should be white or near-black - Updated the /claude-api skill: service account keys and Workload Identity Federation tokens can now manage OpenTelemetry destinations
- Changed
sed -ito get the standard Bash prompt and run as written, not a simulated file-edit preview; like other Bash edits, it is no longer restored by/rewind - Changed
claude ultrareviewto require workspace trust: it asks on a terminal, else refuses; scripts pass--trust-workspace, which takes no value (put a PR number or base branch before it), or setCLAUDE_CODE_DISABLE_ULTRAREVIEW_TRUST_CHECK=1 - Changed the dangerous
rmandrmdirprompt in bypass permissions mode in the Desktop app and VS Code to deny the command at once with a rewrite hint, so unattended sessions keep going - Changed commands the settings exclude from the sandbox to ask before writing to its write-list paths while the sandbox is enabled but cannot run; the unsandboxed fallback is refused there
- Changed worktree creation and reuse so git no longer fetches objects on demand, in ordinary clones and in partial clones with a Bash sandbox configured; such a partial clone fetches them first
- Changed the
/claude-apiskill to build Managed Agents subagent teams onmultiagent_20261001with dynamic workflows on by default, instead ofcoordinator - [VSCode] Added a log warning that says what to do when dictation or the extension's own requests fail certificate verification, such as behind a TLS-inspecting proxy
- [VSCode] Fixed the Claude panel staying blank after the editor cached an incomplete copy of its files; it now recovers by itself, or says what went wrong and how to fix it
- [VSCode] Fixed Session history filling up with empty "Untitled" sessions each time you start a new session without sending a message
- [VSCode] Fixed long slash-command messages such as
/goalfilling the chat panel; they now fold behind Show more like other prompts (#97469) - [VSCode] Fixed long messages not folding behind Show more after the chat panel is made narrower
- [VSCode] Fixed Ctrl+J in the chat input always inserting a newline: it is now left to VS Code and the OS when "ctrl+j" is set to null in the Chat context of ~/.claude/keybindings.json
- [VSCode] Fixed a mod's "From the … plugin" label above the prompt being drawn over the slash command and @-mention menus (#102981)
- [VSCode] Fixed an empty list item, paragraph or code block, and list items renumbered from 1, when pasting copied LaTeX math
- [VSCode] Fixed the feedback error showing only an HTTP status when your organization does not accept feedback
- [VSCode] Improved Edit and Write speed in the chat panel: the wait for new problems after each edit is now 0.75 seconds in most cases, down from 1 to 1.5 seconds
- [Cloud sessions] Fixed the Add connector list in routine forms saying no connectors were available while they were still loading
- [Cloud sessions] Fixed the cloud environment editor shuffling environment variables and adding backslashes to values that contain both kinds of quote
- [Cloud sessions] Fixed the self-hosted environment details dialog in admin settings so its title, tabs and buttons stay in view while only the content scrolls
- [Cloud sessions] Fixed the "read documentation" tool row in cloud sessions, which showed escaped JSON instead of a readable page
- [Cloud sessions] Improved a cloud session's Changes pane, which now says when it lists only pushed commits or only Claude's edits
- [Claude Tag] Fixed Claude in Slack posting a draft you approved for a channel into your DM by mistake; a post with no channel is now refused so it can go to the approved channel
- [Claude Tag] Fixed Allow and Deny on Claude's approval cards in Slack doing nothing when the session had stopped; your answer now restarts the session
- [Claude Tag] Fixed Claude ignoring untagged messages in a Slack channel after its workspace moved to a different Claude organization, including unshared channels on Enterprise Grid
- [Claude Tag] Fixed Claude in a Slack channel posting a threaded reply before reading a newer message someone had just added to that thread
- [Claude Tag] Fixed the Slack page in Claude Tag admin settings saying no workspaces were connected when the list failed to load; it now shows an error with a Retry button
- [Code Review] Fixed a finished review showing no check on the pull request when earlier tries to create it failed; a final try now adds a completed check
- [Code Review] Fixed a push queued behind a running review still starting a review after
@claude review stop; its check now closes and says why
-
🔗 smol-machines/smolvm smolvm v1.31.3 release
What's Changed
- chore(nix): bump flake to 1.31.2 by @github-actions[bot] in #1937
- Allow nested branches 256 generations deep instead of 32 by @BinSquare in #1938
- Speed up first macOS pack imports with reusable storage seeds by @BinSquare in #1939
- Fix Smolfile init steps running twice during cached machine run by @NickyHeC in #1945
- Show init output when cached machine run fails by @NickyHeC in #1946
- Let --allow-udp open chosen UDP destinations, also under an egress interceptor by @AlixANNERAUD in #1941
- Bump smolvm to 1.31.3 by @BinSquare in #1947
Full Changelog :
v1.31.2...v1.31.3 -
🔗 @HexRaysSA@infosec.exchange Hex-Rays has completed its acquisition of HexAI. The HexAI team has joined mastodon
Hex-Rays has completed its acquisition of HexAI. The HexAI team has joined Hex-Rays to bring IDA technology into its agentic platform for cybersecurity research.
Read more: https://hex-rays.com/blog/hex-rays-completes-acquisition-of- hexai
-
🔗 exe.dev Give Your Agents Less Internet rss

Without the Internet, agents are useless. With the Internet, they're dangerous.
One approach is to allow Internet access, but through carefully controlled sippy straws. Let through only requests to destinations that you trust and deny all of the rest.
exe now makes this easy.
TL;DR: Run
ssh exe.dev egress YOUR-VM integrations, or click the Network Access button on a VM's detail page. This will limit YOUR-VM's outbound internet access to any specific integrations you have attached to that VM.Exe integrations provide VMs access to other services, injecting credentials at the network edge so that secrets stay off the VM.
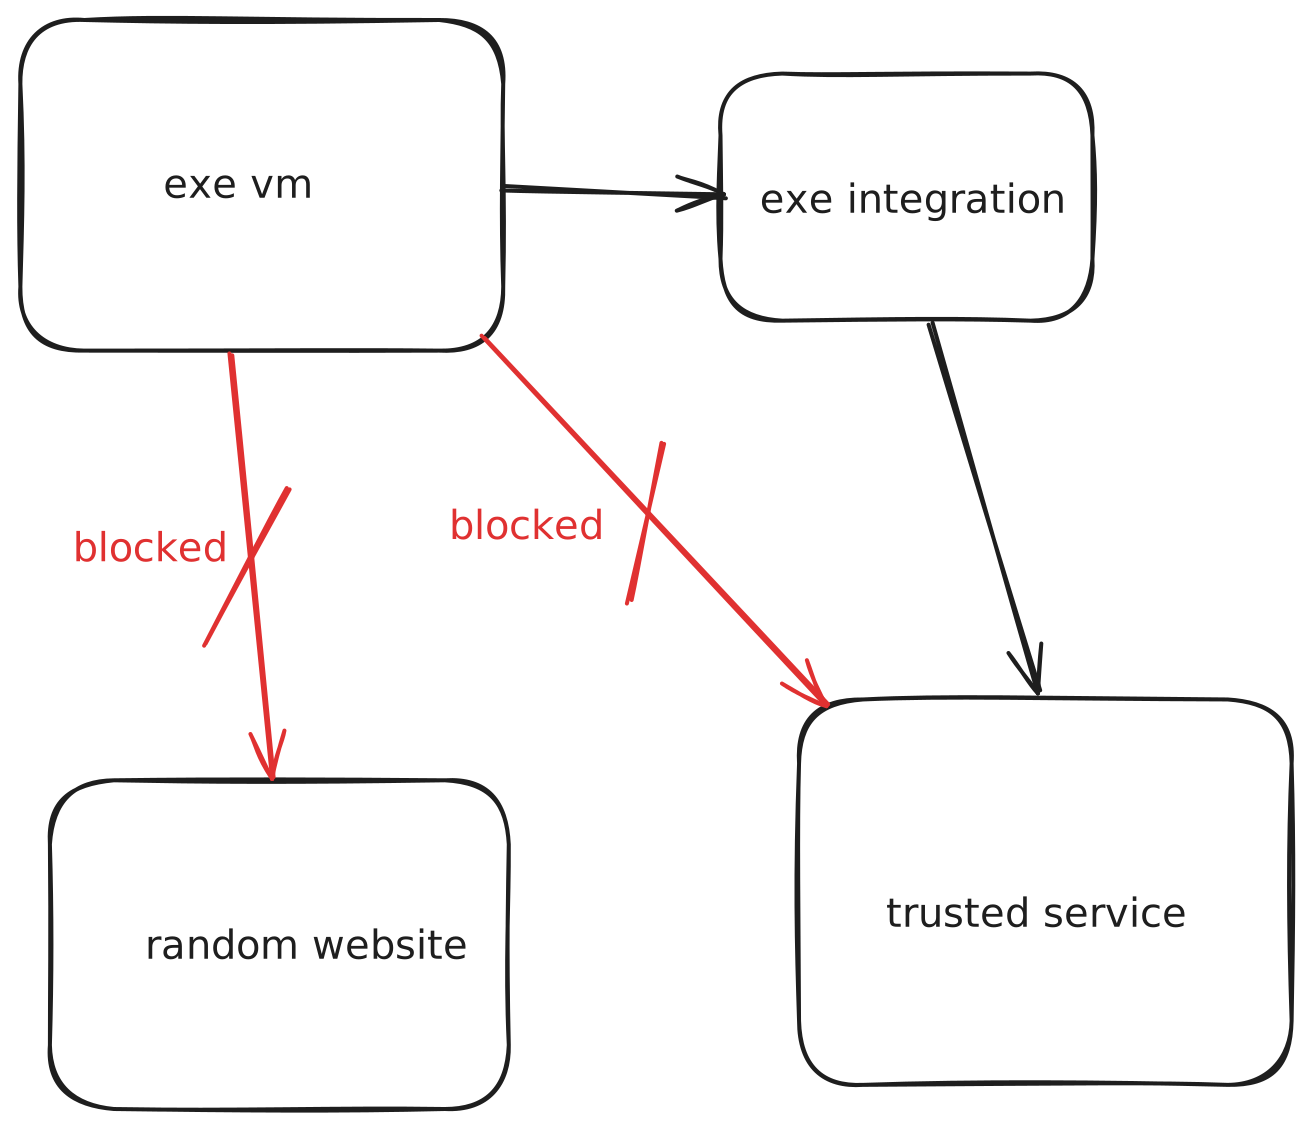
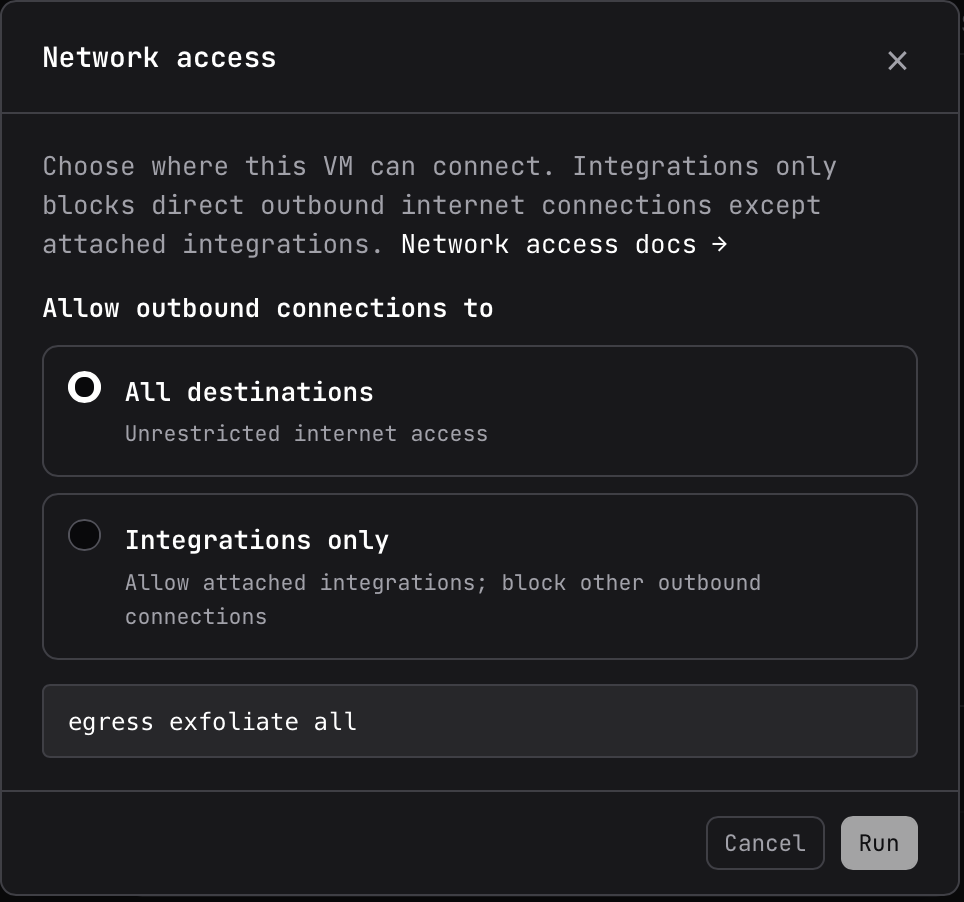
Controlled Ingress, Controlled Egress
Exe manages both ingress and egress. Incoming connections are private by default; you choose who can access your VM.
Outgoing connections are open by default, with integrations providing credentials for connected services. Now you can restrict outbound traffic to just those integrations, giving agents access to the services they need while blocking the rest of the internet.
How It Works
Egress filtering happens at a network packet level. Anything higher level than that is subject to an end run by agents: they have memorized DNS and they can find proxies to convert traffic from one shape to another. We run our own DNS servers to prevent DNS request smuggling. And when you switch egress to integrations-only, we disable server-side web tools on requests sent through our LLM gateway.
People used to say things like "I'm sure it's not secure against a nation- state attacker." Frontier models are the new nation-states. But unlike nation- states, we can pen test ourselves using actual frontier models.
The agents found a bunch of escapes, all through clever use of server-side tools from Anthropic and OpenAI. There were a surprising number of them. Models are clever and persistent. And—when multiple are running on a single VM concurrently—happy to claim credit for the discoveries of others. (Here’s to you, Grok.)
As a result, we closed that entire pathway for requests using our LLM gateway. The rest of our system survived the trial by fire. We believe that we have closed all escape routes straightforwardly discoverable by current models. We will continue to probe in-house as new models are released and harden as needed.
Threat Model
Turning off general-purpose Internet access does make your VM more secure, but this is intended to protect against accidents, not an APT.
Also, it remains incumbent on you to think carefully about what an agent could do via the integrations you have attached. Are they usable as proxies for other purposes? Every read request from your agent is a write to someone else’s logs; are those writes acceptable? Put another way, your trust envelope now includes those external services.
The traditional startup advice is to offer painkillers, not vitamins. Consider this to be Xanax; running agents should not fill you with anxiety that one mistake on their part will have disastrous consequences.
Advanced Mode
Our integrations give you high level access controls: connect to this Postgres server, connect to GitHub, connect to this website. If you want more control, consider setting up a proxy VM for yourself. Then set up a peer integration that allows your controlled VM to talk to your proxy VM. The proxy VM can then run arbitrary software to inspect requests and filter, augment, or forward them.
There are no problems that cannot be solved with another layer of indirection except needing an infinite number of layers of indirection.
Sample Transcript
Create a new VM:
$ ssh exe.dev new --name=no-net
Creating no-net using image boldsoftware/exeuntu...

Coding agent
https://no-net.shelley.exe.xyz

App (HTTPS proxy → :8000)
https://no-net.exe.xyz

SSH
ssh no-net.exe.xyz
It has full internet access:
$ ssh no-net.exe.xyz curl -fsS https://exe.dev
Agent docs: https://exe.dev/llms.txt
Human docs: https://exe.dev/docs
Limit its internet access to integrations only:
$ ssh exe.dev egress no-net integrations
Set egress policy for "no-net" to integrations
Now the same request is rejected:
$ ssh no-net.exe.xyz curl -fsS https://exe.dev
curl: (6) Could not resolve host: exe.dev
Create an integration that provides access:
$ ssh exe.dev integrations add http-proxy --name inception --target https://exe.dev --no-auth
Added integration inception

To use this integration, attach it to a VM first:
  integrations attach inception vm:<vm-name>

Usage from a VM:
  curl https://inception.int.exe.xyz/
Attach it to our VM:
$ ssh exe.dev integrations attach inception vm:no-net
Attached inception to vm:no-net
Access works via the integration:
$ ssh no-net.exe.xyz curl -fsS https://inception.int.exe.xyz/ Agent docs: https://exe.dev/llms.txt Human docs: https://exe.dev/docs -
🔗 Hex-Rays Blog Hex-Rays Completes Acquisition of HexAI to Expand Its Agentic Platform Offering for Cybersecurity Research rss

HexAI's team joins Hex-Rays, the company behind IDA Pro, to bring IDA technology into its agentic security research platform.

-
🔗 The Pragmatic Engineer The Pulse: Anthropic builds its own source control system rss
Hi, this is Gergely with a bonus, free issue of the Pragmatic Engineer Newsletter. In every issue, I cover Big Tech and startups through the lens of senior engineers and engineering leaders. Today, we cover one out of four topics from last week 's issue of The Pulse . Full subscribers received the article below seven days ago. If you 've been forwarded this email, you can subscribe here .
Interesting information from Anthropic about why the company moved off Git and built its own custom source control system. From their engineering blog (emphasis mine):
"At Anthropic, coding is no longer the bottleneck to building systems or doing research. Claude is able to autonomously iterate on research loops, micro-optimize complex programs, and build new services from the ground up at a speed and scale we haven't seen before. The bottleneck, now, is all of the developer infrastructure built for human scale: source control, builds, and CI.
In May 2026, Anthropic averaged around 2,500 code changes merged per day; as of September, we merged over 30,000 per day. We don't expect this rate of growth to slow down anytime soon; the latent demand for merging code is practically infinite, and every bottleneck we remove immediately leads to a further increase in the amount of code we produce."
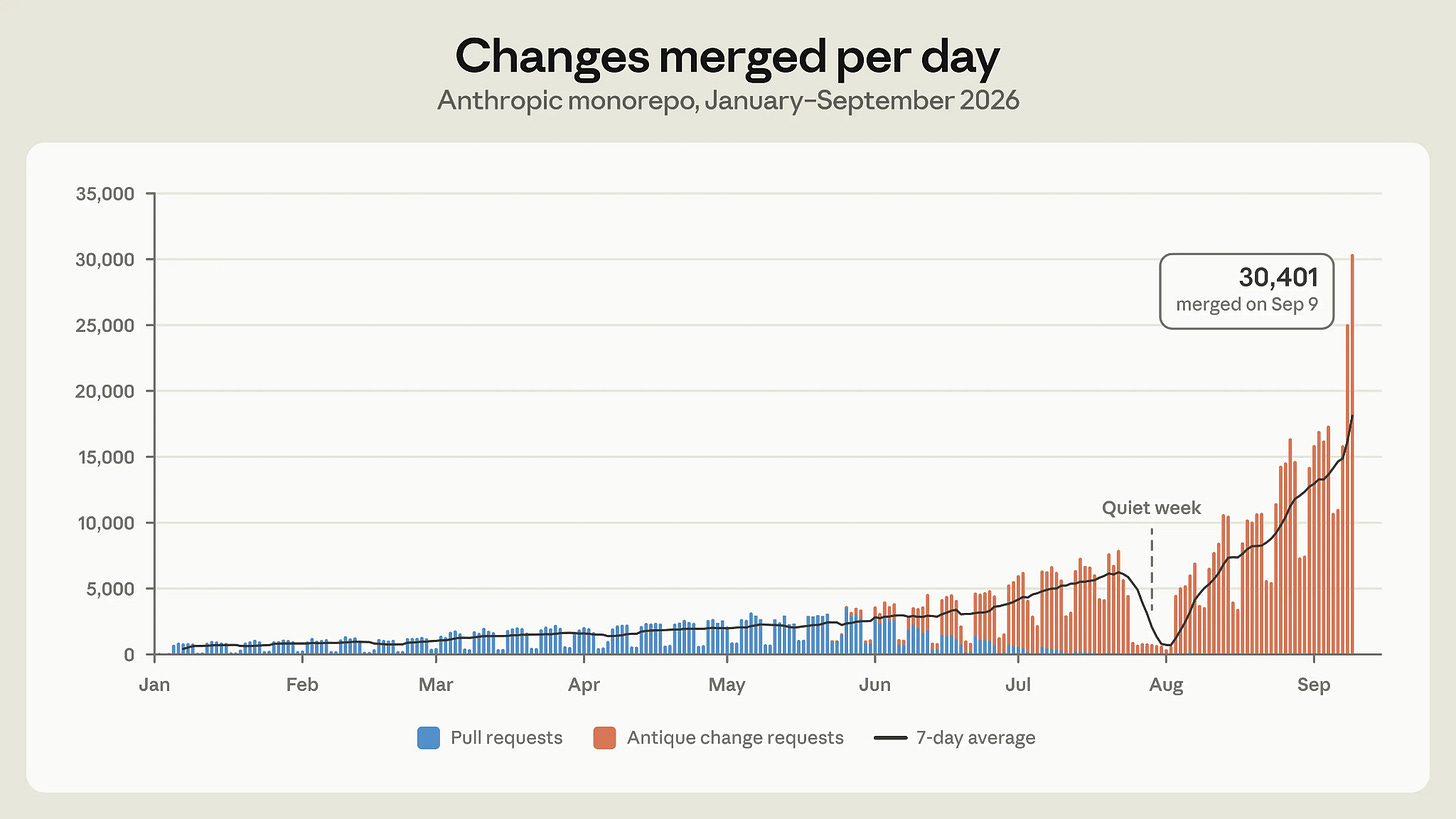 Anthropic
saw PRs merged per day snowball 10x in less than 4 months ' time. Source:
Anthropic
Anthropic
saw PRs merged per day snowball 10x in less than 4 months ' time. Source:
AnthropicThat's a 12x increase in PRs in a four-month period! Interestingly, just a year ago, I shared how I had gathered Google was preparing for a similar tenfold increase across its broader infrastructure. From the deepdive published in July 2025:
"Google is preparing for 10x more code to be shipped. A former Google Site Reliability Engineer (SRE) told me: 'What I'm hearing from SRE friends is that they are preparing for 10x the lines of code making their way into production.'
If any company has data on the likely impact of AI tools, it's Google. 10x as much code generated will likely also mean 10x more code reviews, deployments, feature flags and source control footprint."
Back to Anthropic, a few things about the company are different from many other tech businesses:
- Use of a monorepo. Like most large tech companies, Anthropic has a massive monorepo, where the working copy itself is 25GB in size.
- 25 million git checkouts per day, just for CI! All ~3,000 staff extensively use parallel Claude agents - typically 10-15 per engineer - so a lot of pull requests are created; somewhere in the region of 30,000 per day. All these PRs trigger a massive number of checkouts, mostly from the CI system.
- Nearly all clients are always online. Git was built on the assumption that clients go offline at various times, and that when they come back up, they need to catch up with branches and merge their changes into the repo. However, when clients are always connected to the corporate internet - like at Anthropic - this assumption no longer holds. Design decisions to accommodate offline clients mean inefficient checkouts and more data transferred than necessary.
- Hard to horizontally scale git. Scaling git is done by running git mirrors: replicating git repositories across several mirror nodes. A primary git server accepts the writes, pushes out to all mirrors, and clients fetch from various mirrors. Anthropic ran hundreds of git mirrors, but found that once their repo outgrew the mirrors' disk capacity, they could no longer scale the repo.
So, Anthropic created a new source control system, which is called**** 'Scion' internally. It's closed source, and Anthropic has shared the high- level design principles and data structures used, but no code details. The problem with having your own source control system (and moving off Git and GitHub) is that GitHub's code review system is lost! So, Anthropic also had to build a new code review and code management system, which they call 'Antique.'
I reached out to the team building Scion and Antique to learn more about how Scion works. Here's what they told me:
Technical details
The design of Scion is pretty simple: stand up "server" nodes (that contain the whole repository), store changesets inside of Google Spanner (Google's distributed, highly available database) and blobs (large files) in the highly durable Google Cloud Storage:
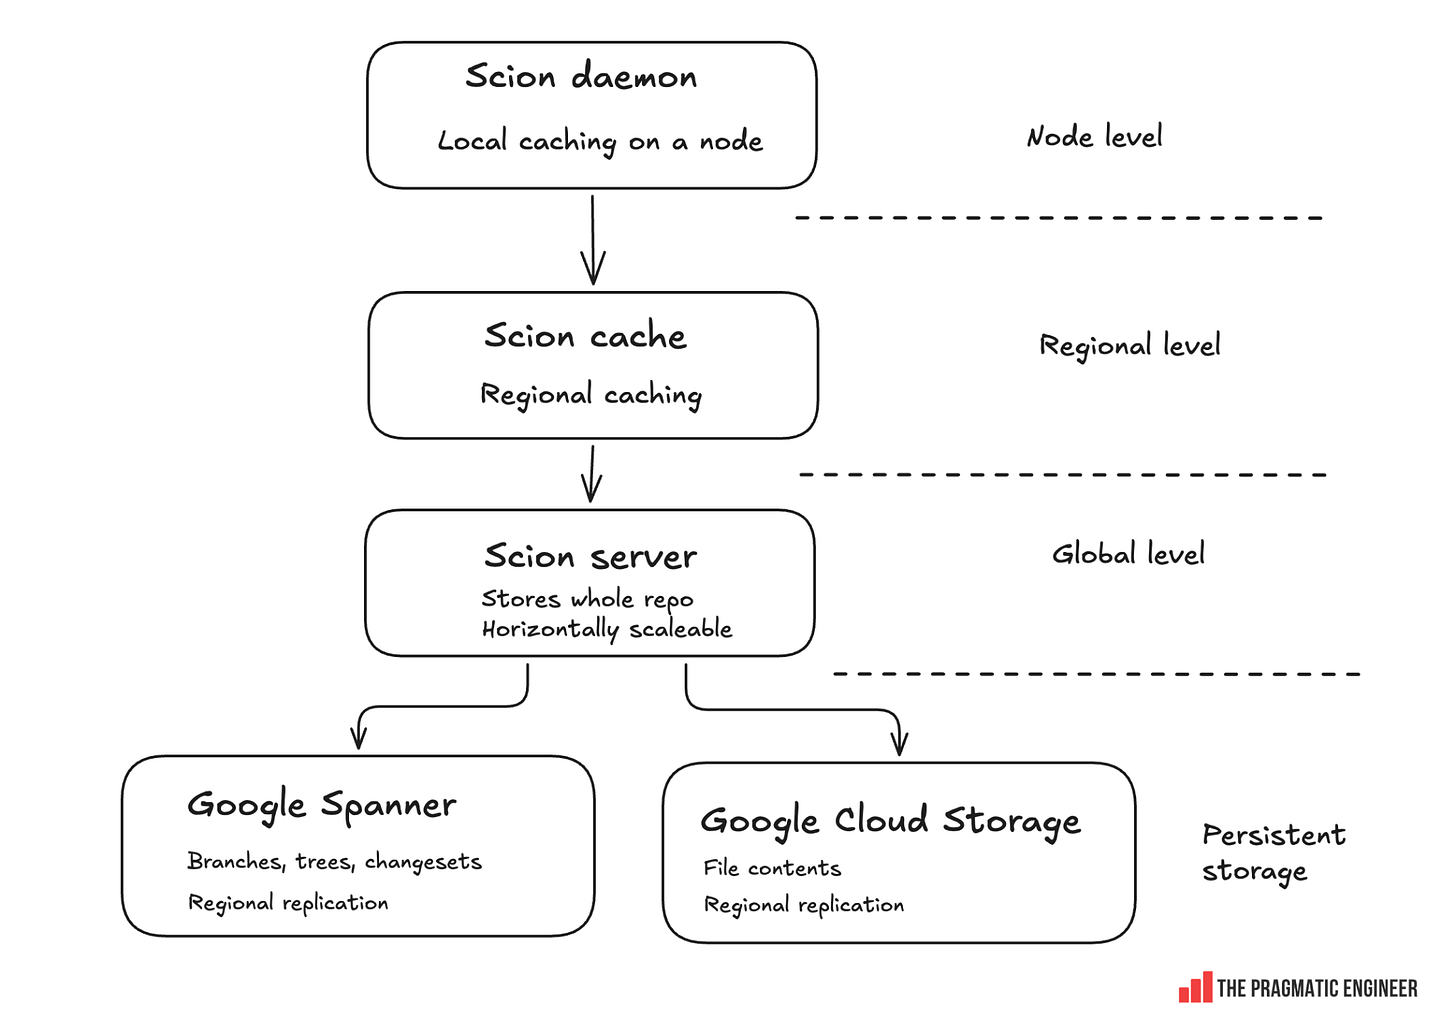 Scion's
architecture, at a high level
Scion's
architecture, at a high levelI asked Nick G - one of the authors of the original blog posts - about additional details and here's what he told me:
- Rust : the language that Scion's server and client are written in.
- Go + React: Antique, Anthropic's new code review and code management platform has its backend in Go and frontend written in React. It works nicely with Scion.
- More resilient replication strategy : by default, Google Spanner offers multi-zone replication with three replicas. Anthropic has increased the number of replicas (they didn't tell me the exact number, but an educated guess could be five or more replicas), and switched to multi-region replication. All these changes make sense, given how critical code is and that it 's sensible to reduce the likelihood of losing any data - even at the cost of higher write latencies.
- Backups : on top of replication, Anthropic keeps full backups of the database and soft deletes on the blob storage where file contents live. Spanner's point-in-time recovery also lets Anthropic restore from a bad write. Smart!
Scaling is an interesting topic. I asked Nick if the system autoscales or scales manually. He told me:
"Every component can autoscale, but so far it hasn't needed to, even as our merge volume grew more than 10x this year. The data is content-addressed and never changes once it's stored, so the caching tiers do most of the work."
A team of seven engineers builds and maintains all of this :
- Four worked on the core Scion server and client
- Three were split between building code search, merge queues, etc.
100% of Anthropic 's monorepo has moved off Git. This was no small feat to pull off! Nick gave me more details about the migration:
"The migration was not simple, but Claude was instrumental in getting it done. It's also 'self-healing' in a way: if we get all the important use cases migrated and have something like 99% coverage, we can just force the cutover and Claude can help us fix anything that actually mattered.
100% of our monorepo is off of git. A few smaller repos that were never in the monorepo are migrating now, and they're much simpler.
All of our community resources continue to live on GitHub: skills, plugins, Claude Code's public repo, etc. And last week we launched OSS Scanner, which gives open-source projects free security audits using our strongest models (inspired by Google's OSS- Fuzz)."
Big Tech moved off Git long ago
My take is that Anthropic has "Big Tech problems" much earlier than most of Big Tech had to tackle them. Anthropic employs around 3,500 staff, but their coding output - thanks to each person using around 10 agents all the time - is closer to that of a tech company with 35,000-70,000 staff! That's a Meta or Google-sized company by the number of engineers.
Google and Meta have long since moved off Git because it did not scale for them.
Google built its own version control that took inspiration from Perforce. Git itself was created by Linus Torvalds in 2005, seven years after Google was founded. So git was not an option for Google to use in the early years: the company chose Perforce instead. It was around 2011-2012 that Google had ran into scaling issues with Perforce and built its own source control system called 'Piper.' It's also a centralized version control model and still works well enough for the search giant. It's no surprise to know that Piper was inspired by Perforce, and Google built Piper to be more performant for their use cases than Perforce was. We covered more on Google 's internal stack in the deepdive Inside Google 's Engineering Culture .
Meta found that git and other systems could not scale as needed, and so built 'Sapling.' Meta initially moved over to Mercurial, and then custom- built and open sourced Sapling for itself. As the company shared at the time:
"Sapling began 10 years ago [around 2012] as an effort to make Meta's monorepo scale in the face of ever-increasing engineering growth. Publicly available source control systems were not, and still are not, capable of handling repositories of this size. Instead of moving away from the monorepo and sacrificing engineering velocity, we decided to build the source control system we needed.
Along the way we realized there were also large opportunities to increase developer velocity by improving the source control experience. By investing in new UX, we've made it possible for even new engineers to understand their repository and do things that were previously only possible for power users."
Sapling itself is more of a client-server architecture. From the documentation:
"Sapling started from Mercurial as a distributed source control system, it then transitioned to a client-server architecture to solve the challenges. The server can utilize distributed storage and pre-build various kinds of indexes to provide more efficient operations.
While Sapling is less "distributed", we tried to make the difference transparent to the user. For example, our lazy commit graph implementation does not require extra commands to "deepen" the graph. The user sees the full history.
That said, we do drop support of pulling from a lazy repo. Commit cloud covers these use-cases."
Did Anthropic secretly rip off Sapling 's and Mononoke server
I asked Anthropic why it doesn't open source Scion. Nick G's reply:
"Mostly bandwidth! Even a no-support code drop takes a lot of work to do well. We have a small team building and running Scion. While the principles we used to build it are durable, the underlying code changes very frequently. For example, we're still removing git-compatibility layers we only needed for the migration. We'd rather put that time into sharing what we learned, and as the post says, into working with GitHub, GitLab and the OSS community on scaling git.
To emphasize that point: most teams don't need to leave git! But we think there are things git could benefit from, mainly change sets, derived data, and the checkout protocol. Our goal was to inspire conversation and collaboration around those ideas."
The explanation, on one end, makes sense. On the other, Meta themselves also emphasized how most teams don't need to leave git, and still open sourced Sapling for anyone to use, or take inspiration from.
One key component of Sapling is Monoke: the also open source server meant to scale up accepting thousands of commits every hour, across millions of files, written in Rust.
Could have Anthropic avoided open sourcing Scion, because it might have shown how much they copied from existing open source projects? The creator of Monoke wrote a post accusing of the Anthropic team of ripping off Monoke -- and the Bonsai data model -- writing:
"This [Scion] was a ripoff. My post yesterday was trying to be as charitable as possible given what I knew, and in particular that the similarity to Mononoke was mostly unintentional and the lack of credit was the result of not doing due diligence. However, after publishing the post I privately received confirmation that Scion intentionally and blatantly ripped off Mononoke, and in particular that there was overlap in personnel. There is no chance that this was an unintentional homage. This is something I had a hunch about but was not comfortable saying yesterday, given what I knew back then.
The resemblance is much deeper than just the notion of derived data. Some people pointed out that derived data is just an index, which is a well-known concept. I want to clarify that derived data was merely the most striking resemblance. It goes much deeper than that, and extends to the entire data model, as well as a number of the structures built around it."
Anthropic did not give credit to Monoke in their original post, and only added a small attribution after the complaint.
To be clear, the point of open source is that you can do what you want with the software without much limitations (save for what the license contains): but it's poor form that it took a public complaint for Anthropic to admit that the clever data structure they presented in their blog post heavily derived for an existing and open source data strucutre.
Will central VCs stay a niche, or expland beyond Big Tech?
Big Tech has preferred centralized version control systems (VCS), and I wonder how niche of a trend central VCSs will remain. As we've seen since well before AI, some of the largest tech companies dropped git because they did not like the performance degradation from offline support they no longer need.
My question is that even with agents, how many companies will see git "break" similarly to how it has at Anthropic? When this happens, how many will find git's mirroring functionality inadequate for their own needs?
There's a new batch of vendors positioning themselves as git-compatible version control solutions built for AI scale: Entire, founded by GitHub's last CEO, Thomas Dohmke (a current podcast season sponsor), Cursor Origin by SpaceX, and Code Storage by The Pierre Company. At the same time, GitHub itself seems to be investing a lot more in making its platform more reliable and scalable.
My hunch is that very few companies will go through the trouble of building yet another source control system. In this way, Anthropic reminds me a bit of Google, which has been known to build custom internal systems which are not publicly available, to address the company's internal needs. This can be disorienting for Google engineers after they leave the company and find they've become out of touch with industry-standard tools.
Read the full issue of The Pulse this is from, or check out this week 's The Pulse. This week's issue covers:
- Do we need to rethink software security because of AI? Half a dozen of high-profile security incidents and breaches on a single day: and many of them are connected to AI (or sped up because of it). Attackers are gaining unfair advantages with AI, and defenders will have to react.
- Is Anthropic 's new version control system "a rip off"? The creator of Mononoke (an open source, high throughput version control server) accused Anthropic for ripping off their design, and not giving credit, presenting their work like it was novel. Not a good look on the AI lab.
- Industry Pulse. Saudi Arabia made a "problematic" offer to pay alleged OpenAI spy's bail, Shopify builds tooling for self-healing software, Foursquare's sale disappoints, Claude Code gets a major speed boost with gzip, and more.
- Predictions on the future of software development. Some bold predictions from software engineer and Amp cofounder Thorsten Ball, like how open source doesn't make sense in its current form anymore.
-
🔗 r/LocalLLaMA Qwen4 and Kimi3.1 on Arena apperantly rss
Im so hyped for qwen4 flash
submitted by /u/thatscoolbutno123
[link] [comments] -
🔗 Console.dev newsletter Sponsor: Falconer rss
Monitor your docs like your code. Falconer finds and fixes doc issues before they mislead agents.
-
🔗 Console.dev newsletter Pele rss
Mermaid diagram render.
What we like: Renders Mermaid syntax to SVG. Colors and fonts are customizable through CSS. Zero dependencies. Responsive layouts and very fast render times (under 1ms).
What we dislike: Doesn’t support all diagram types or Mermaid plugins.
-
🔗 Console.dev newsletter KiviDB rss
Redis/Valkey alternative.
What we like: Redis-compatible protocol, including search, vectors, and Lua scripting. Commands run on every core rather than one thread. Claims faster performance than Redis, including better p99 latency. Runs on a different port by default. Written in Rust.
What we dislike: Licensed under AGPL.
-
🔗 Console.dev newsletter Sponsor: BuildKite rss
Better CI
-
🔗 backnotprop/plannotator v0.28.26 release
Follow @plannotator on X for updates
Missed recent releases? Release | Highlights
---|---
v0.28.25 | Re-ask open questions, delivery ticks on the list, a count of new messages on the tab, right-click a thread, click Inbox to refresh
v0.28.24 | A new look for the Inbox, Send now, tag agents, comment on an agent's message, much smaller reads for agents, links in HTML pages
v0.28.23 | Inbox replies reach sessions with background subagents, dictated text no longer goes missing, 👍 Looks good reaches the agent, notifications that never fail silently
v0.28.22 | 👍 Looks good, full view for files, one viewer for a thread's images and files, every session prints its URL,PLANNOTATOR_BROWSER=noneopens nothing
v0.28.21 | Message an agent from the Inbox, video attachments, Open in for attachments, Code / Tests / Generated in code review, writes from other websites refused
v0.28.20 | Inbox search (⌘K), real folder names for projects, data files open in the code view, word-only replies leave questions open
v0.28.19 | Ask this session in T3 Code, folder sessions load shared stylesheets and images, the agent note asked once per agent, Copy connect prompt
v0.28.18 |plannotator inboxconnects your agents, agents are told when to use the Inbox, rendered Markdown in code review, Inbox Settings in sections
v0.28.17 | The Inbox on iPads and narrow windows, the reply bar no longer cuts off "Keep open", a Pi crash on/reloadfixed
v0.28.16 | The Inbox on a phone, a doorbell for new questions, Mark read, step through a thread's files, replies when the asking session ended
v0.28.15 | Long Inbox threads fold to what is new, "Skipped N questions" replies, Inbox list and sidebar fixes
v0.28.14 | Agents can replace an earlier question, comment on a guided review in the Inbox, issue numbers link to the repositoryWhat's New in v0.28.26
Action items and reply drafts in the Inbox, one decision button for plan review, Enter to save a comment, a custom code font, and many fixes. 35 PRs, 9 of them from 8 outside contributors, 5 of whom are first-timers.
Plannotator Inbox
Action items
An agent can ask you to go do something: run a command, sign in somewhere, check a page. It shows as a card in the thread with Done , Can't do it and Add note , and your answer goes back to the agent.
Reply drafts
What you type in a reply box is kept per thread. It comes back when you reopen the thread, after a reload, and after a restart. A thread with an unsent draft is marked Draft in the list.
Replies to a busy agent go in on their own
If the agent is in a long turn, the line under your reply shows how long it has waited, and after 5 minutes the reply goes into the running turn by itself, as if you'd pressed Send now.
Smaller changes
- A Send skips a question only when you press Skip. Questions you leave alone stay open. #2058
- Answers you pick while writing a reply show in the reply box right away. #2051
- A skipped question keeps its note in the reply. #2034
- Several Inbox tabs share one connection to the Inbox. #2057
- Subjects stay on one line , and stray tool-call text never becomes a title. #2053
- A thread that fails to load tries again and says so. #2054
- Faster over your tailnet : the window is sent compressed. #2042
- Long issue numbers link as issues , not colour swatches. #2040
- Restart help leads with
/reload-plugins. #2035 - Works behind a local reverse proxy (nginx, Caddy). #2060
Plannotator
One decision button for plan review
Plan review's header now works like annotate and code review. With nothing to send it shows Approve. Once you add comments it becomes Send Feedback. Other choices, such as Request changes or Approve with notes, are under the arrow.
Enter to save a comment
Turn on Settings → General → Enter saves a comment , and Enter saves while Shift+Enter adds a new line. It's off by default.
Your own code font
Settings → Display → Code Font → Custom… takes the name of any font on your machine for code review.
Start a new Ask AI chat
A New chat button clears the Ask AI panel and starts fresh, in plan review, annotate and code review.
Jump between changes in code review
N and P jump to the next and previous change. Commenting from the gutter now covers every line you selected, not just the one you clicked.
Smaller changes
- A code review an agent waits on hears your Approve (Claude Code). #2047
- Annotate picks up a file changed on disk in its version diff. #2049
- A plan reviewed across midnight keeps its versions. #1681 by @aomalov
- Images in a folder session load from the open document's folder. #2033 by @xiaofeilovecoding
- Sidebar shortcuts stay visible next to the Agent TUI. #1019 by @leoreisdias
- A
file.ts:42link opens at line 42. #1909 by @Totopo27 - Triple-click no longer highlights into the next line. #1408 by @dca123
- Ticking a Guided Review section marks its files viewed. #2044
- Very large diffs from git textconv are never drawn. #2041
- Pi: review opened and closed events, and long checklists keep the next item in view. #2050
- OpenCode: the agent-switch choice is saved, and Ask AI no longer hangs. #2045, #1413 by @danowicz
- Claude Code Team/Enterprise: a plan is approved once, not twice. #2043
- The install script works on machines without
gh. #1995 by @viniciusestevam
Install / Update
macOS / Linux:
curl -fsSL https://plannotator.ai/install.sh | bashWindows:
irm https://plannotator.ai/install.ps1 | iexClaude Code Plugin: The plugin and the
plannotatorbinary update separately, so run the install script above as well. In a terminal:claude plugin marketplace update plannotator claude plugin update plannotator@plannotatorThen restart Claude Code. Inside Claude Code, run
/plugin marketplace update
plannotator
, then open/plugin→ Installed → plannotator → Update now.Pi:
pi update --extensionsOpenCode: Re-run the install script above. It now also clears the OpenCode 2 plugin cache.
What's Changed
- feat(review): custom code font support by @backnotprop in #855
- feat(annotate): keep sidebar shortcuts visible with Agent TUI by @leoreisdias in #1019
- Fix triple-click highlight bleed into the next line by @dca123 in #1408
- fix(ai): keep OpenCode Ask AI subscribed before prompting by @danowicz in #1413
- fix(review): full-range gutter annotations and next/prev hunk jump by @FNDEVVE in #1550
- fix(plan): keep the version chain when a review spans midnight by @aomalov in #1681
- fix(ui): scroll and highlight referenced line in code file popout by @Totopo27 in #1909
- Installers: resolve latest from the releases/latest redirect when the API fails by @viniciusestevam in #1995
- Inbox Board (1/3): card records and the card call by @backnotprop in #2026
- Inbox: reply drafts and the Draft label by @backnotprop in #2028
- fix: resolve folder images from the active document by @xiaofeilovecoding in #2033
- Inbox: keep a skipped question's note in the reply by @backnotprop in #2034
- Inbox: lead with /reload-plugins, fold the manual restart by @backnotprop in #2035
- CI: pin Linux runners to ubuntu-24.04 by @backnotprop in #2036
- Inline markdown: digit-only #refs link as issues, not colour swatches by @backnotprop in #2040
- Review: never render a textconv diff past the size cap by @backnotprop in #2041
- Inbox: serve the window compressed over the tailnet by @backnotprop in #2042
- Claude Code mod: one plan approval when the plugin guard skips the mod's hook by @backnotprop in #2043
- Guided Review: ticking a section marks its files viewed by @backnotprop in #2044
- OpenCode: remember the agent-switch choice in config.json by @backnotprop in #2045
- Ask AI: start a new chat by @backnotprop in #2046
- Code review: gate, so a bare Approve reaches the agent by @backnotprop in #2047
- Comments: opt-in Enter to save by @backnotprop in #2048
- Annotate: a disk change shows in the version diff by @backnotprop in #2049
- Pi: session events and a checklist that keeps the next item in view by @backnotprop in #2050
- Inbox: answers picked while writing a reply show live in the reply box by @backnotprop in #2051
- Tests: fix main's DOM allowlist failure by @backnotprop in #2052
- Inbox: one-line subjects; leaked tool-call text never shows as a title by @backnotprop in #2053
- Inbox: read a thread again when its first read fails, and say so by @backnotprop in #2054
- Plan review: one adaptive decision control by @backnotprop in #2055
- Inbox: Undelivered replies show their wait and go in by themselves after 5 minutes by @backnotprop in #2056
- Inbox: tabs share one event connection by @backnotprop in #2057
- Inbox: a Send skips a question only when you press Skip by @backnotprop in #2058
- Inbox: action items an agent needs you to go do by @backnotprop in #2059
- fix(inbox): allow loopback x-forwarded-for from local reverse proxies by @Totopo27 in #2060
New Contributors
- @viniciusestevam made their first contribution in #1995
- @xiaofeilovecoding made their first contribution in #2033
- @aomalov made their first contribution in #1681
- @danowicz made their first contribution in #1413
- @Totopo27 made their first contribution in #1909
Contributors
- @FNDEVVE: full-range gutter comments and hunk jumps in code review.
- @leoreisdias: sidebar shortcuts beside the Agent TUI.
- @dca123: the triple-click highlight fix.
- @Totopo27: line-accurate code links, and the Inbox behind a local reverse proxy.
- @aomalov: reported and fixed plans that lost their versions at midnight.
- @danowicz: the OpenCode Ask AI hang.
- @xiaofeilovecoding: folder images from the open document.
- @viniciusestevam: reported and fixed the installer without
gh.
Thanks to everyone who reported issues or asked for features in this release:
- @solalbaudoincs (#1867), @akaralar (#851), @clauxx (#1934), @alexanderkreidich (#991), @andrew-corlann (#1543), @levyashvin (#1057), @kekel87 (#1907), @ppommer (#1981)
- @RobertoArtiles (#1784), @PassionZale (#2006), @viniciuskneves (#2037), @michaelmior (#1412), @jumski (#1589), @sergdort (#1390), @oronbz (#1786), @ericknyoto (#2007), @zane668 (#2032), @timmo001 (#1932)
Full Changelog :
v0.28.25...v0.28.26 -
🔗 pydantic/monty v1.3.0 - 2026-10-21 release
What's Changed
- Decode file URLs in WASM and browser test aliases by @Pybsama in #1007
- test: check packed WASM declarations in smoke tests by @Pybsama in #1004
- Fix
re.match()andre.fullmatch()for(?x)patterns that end in a comment by @Likheet in #1046 - close further missing dunder gaps by @davidhewitt in #1074
- tidy up some looseness in the
HeapReader::protectAPI by @davidhewitt in #1076 - perf: avoid intermediate string id allocation on keyword call dispatch by @gabrielhsc95 in #1080
- Match CPython's odd padding split in
str.centerandbytes.centerby @RaphaelFakhri in #1085 - experiment with making bytecode from builtins by @davidhewitt in #841
- implement
PyValueabstraction to avoidInternStr/Strdiffs etc by @davidhewitt in #1050 - Bound AST depth before the type checker walks it by @rewitt94 in #930
- bump deps for CA compromise by @davidhewitt in #1096
- release: 1.3.0 by @davidhewitt in #1097
- fix npm smoke test by @davidhewitt in #1099
New Contributors
- @Pybsama made their first contribution in #1007
- @RaphaelFakhri made their first contribution in #1085
Full Changelog :
v1.2.0...v1.3.0 -
🔗 smol-machines/smolvm smolvm v1.31.2 release
What's Changed
- chore(nix): bump flake to 1.31.0 by @github-actions[bot] in #1917
- Never lower a branch source's memory ceiling below what its cgroup still holds by @BinSquare in #1921
- chore(nix): bump flake to 1.31.1 by @github-actions[bot] in #1923
- Fix flaky branchpoint lease test by @BinSquare in #1918
- Let machine monitor flags override the Smolfile health settings by @RaphaelFakhri in #1920
- Give a new disk volume the image's ownership and bind nested volumes after their parents by @BinSquare in #1870
- ci: run every Linux job on smol machines by @BinSquare in #1916
- Change ports live on machines without virtio-net through a vsock port forwarder by @BinSquare in #1875
- Add Chinese, Japanese and Korean READMEs by @BinSquare in #1871
- Pass the guest path to ns-file and stage on scratch for streamed container uploads by @Vishv07 in #1925
- Isolate filesystem unit tests from the CI runner overlay by @BinSquare in #1927
- agent: unit tests never resolve paths through the machine they run on by @BinSquare in #1926
- Checkpoint a source frozen as a branch base without resuming it, so its branches can move to another node by @BinSquare in #1928
- Keep cache disk bases within a byte budget, evicting the least recently used by @BinSquare in #1930
- Bump smolvm to 1.31.2 by @BinSquare in #1929
- Put /tmp on disk, regrow /dev/shm after a RAM grow, match GitHub runner limits and LANG by @BinSquare in #1931
- Record why a machine's VMM ended, OOM kill and seccomp included by @BinSquare in #1884
- Fix inherited disk-chain compaction by @BinSquare in #1933
- Move a live-published host port to another guest port without rebinding it, and close removed ports before the change returns by @BinSquare in #1935
- Unpack a .smolmachine once per pack on macOS and clone it for each machine, and let no create leave its data behind when it fails or its client disconnects by @BinSquare in #1934
- Keep a machine's disk durability across checkpoint restore and let machine update change it by @BinSquare in #1932
- Answer a branch at the disk chain limit with 409 instead of 500 by @BinSquare in #1936
New Contributors
- @github-actions[bot] made their first contribution in #1917
- @RaphaelFakhri made their first contribution in #1920
Full Changelog :
v1.31.0...v1.31.2 -
🔗 OmniNull/OmniWM Canary 20261022-0439 (8ecdfbff) release
Automated canary build of
main. It is signed and notarized like a release but skips the owner review, so treat it as unstable.See the canary guide to install, update, or return to stable. For everyday use, download the latest stable release.
- Commit:
8ecdfbff1327 - Base tag:
canary-20261020-1054-39408104600-1
Changes since canary-20261020-1054-39408104600-1
8ecdfbfMerge pull request #938 from dappermint/fix/command-palette-shortcuts20204d2Merge pull request #937 from dappermint/fix/live-wallpaper-capture6f734a5Merge pull request #936 from dappermint/perf/idle-1019ae50decMerge branch 'main' into perf/idle-1019223c61eMerge pull request #935 from dappermint/perf/input-1019f1adb34fix(palette): match shortcuts by key position on non-qwerty layoutsca21cc4fix(wallpaper): keep live wallpaper captures already clipped to the display480451btest(input): check captured drags still reach main, keep the forward private91a3049fix(wallpaper): keep the crop at the display size for fractional window origins0e9b55dtest(shell): assert both backdrop filters survive a fill only repaint49a3955fix(wallpaper): capture live wallpapers drawn above the desktop levelc20322eMerge upstream/main into perf/idle-101976364c3Merge upstream/main into perf/input-1019d2a6d2fMerge pull request #934 from OmniNull/dependabot/npm_and_yarn/website/npm_and_yarn-63f9813d79e81e6f1build(deps): bump vite707d37dKeep settled tab rail moves on SkyLight after animation moves0b5fa2bSkip tab rail relayout when its size is unchanged2b75644Check screenshot selection once per pointer-validated focus handoff19980a7Merge pull request #931 from dappermint/test/stabilise-shell-ui-tests6af545ctest(shell): wait for the drawer package before toggling its popoutfaa6219fix(surface): ignore registrations whose window was deallocated39bcaaaPass query options instead of a window count to SkyLight queries7de1437Render launcher icons in the system icon stylebdeeddbSkip clipboard items that macOS excludes from history5b1beb0Read window fullscreen state in the admission attribute batch1059fa2Query a dragged window's identity off the main connection2736ce5Merge pull request #927 from CallMeLaNN/fix-zsh-completion55a2737docs: initialize compinit before evaluating zsh completions023b7b3test: cover zsh completion eval registration and autoload paths4b0d1f4test: wrap long completion harness linesd1f28f2test: call zsh completer explicitly in completion harnesses2aeb8d9Merge pull request #914 from hezhizhen/codex/dwindle-native-live-resize8b1b400fix: use AX fallback for final native resize framesbf662abperf: avoid duplicate native resize renders on release7f33a6cfix: avoid world commits for rejected native resizes416f198feat: resize Dwindle neighbours during native edge dragseaf668cfix: zsh completions for eval based on official doc9481efetest(shell): cover fill-only repaint keeping backdrop filters4c18d61perf(input): stop captured drags from blocking on the main threada792655perf(idle): cut idle wakeups and redundant layer work
- Commit:
-
🔗 anthropics/claude-code v2.1.308 release
What's changed
- Bug fixes and reliability improvements
-
🔗 r/LocalLLaMA Kitten-TTS 2: New Open-source SOTA 1.58 bit TTS (CPU-only with voice cloning, multilingual, emotion control) rss
 | KittenML has just released code and weights of Kitten-TTS 2, which is a super-efficient frontier TTS model, and the world's first 1.58-bit TTS model. It runs in real time on just a CPU, with zero-shot voice cloning, multilingual support, and expressive / emphasis control. Code and weights are open-source. Ternary(1.58-bit) Weights means it can run locally or be self-hosted for super-cheap. Github: https://github.com/KittenML/KittenTTS
Hugging Face: https://huggingface.co/KittenML/kitten-tts-2
KittenML's Discord: https://discord.com/invite/VJ86W4SURW Key features and Advantages- Ternary TTS: Every linear weight in the body is one of three values (-1, 0, +1) with group size of 128 for scales. Tiny footprint and fast CPU inference. The model has 1.7B parameters.
- Real-time on CPU and consumer GPU's too : No GPU needed for real-time generation. Optimized ternary kernels for CPU inference provided.
- Expressive voice cloning : zero-shot cloning from less than 5 seconds of reference audio, and it keeps the expressivity, accent information etc. No fine-tuning needed.
- Multilingual TTS: Model supports voice cloning in 20+ languages. Cross-language voice cloning can be used to create accented speech too.
- Expressive / emphasis control: you can steer the delivery and stress specific words, not just pick a voice. Details in the Readme.
- Open source (hell yeah!) : code and weights are open-source and free to use. It's an oss alternative to elevenlabs for gpu-poor folks. easy to self-deploy or run locally.
7. What changed from V0.8 to 2: higher quality. Completely new architecture, natural sounding speech, ternary weights, zero-shot voice cloning, multilingual, and emphasis/emotion control. submitted by /u/ElectricalBar7464
[link] [comments]
---|--- -
🔗 Ampcode News Self-Hosted Orbs rss
You can now self-host orbs. You provide the compute and Amp turns it into orbs.
If you have compute that can
- quickly start new machines
- put them to sleep and resume them equally fast
- keep them around for a long time
- scale them to zero, so no one has to worry about having a lot of them sleeping
then you are now able to replicate the orb experience within your own infrastructure.
How It Works
You run
amp orb providerinside your infrastructure. Theorb providerthen reaches out to Amp and waits for requests to spawn, pause, or delete orbs. Like this:
How you satisfy those requests is up to you, because
amp orb providerwill dispatch the requests for orb operations (spawnto create or resume orbs,pause, anddelete) to a program that you provide, like so:$ amp orb provider ./dispatch.shIn that program, you can do whatever works best for your infrastructure. Here are some illustrative examples:
#!/usr/bin/env bash
# dispatch.sh
set -euo pipefail

case "$ORB_OPERATION" in
    spawn)
        docker start "$ORB_ID" 2>/dev/null ||
            docker run --platform linux/amd64 -d --name "$ORB_ID" \
                "$ORB_IMAGE" sleep infinity
        docker exec -d --env ORB_TOKEN "$ORB_ID" amp orb bootstrap
        ;;
    pause)
        docker stop "$ORB_ID"
        ;;
    delete)
        docker rm -f "$ORB_ID"
        ;;
esac
Install the E2B CLI and the
e2bpackage, setE2B_API_KEY, and build a template:echo 'FROM us-central1-docker.pkg.dev/amp-prod-0/amp-orb/amp-orb:latest' \ > e2b.Dockerfile e2b template create amp-orbs --dockerfile e2b.Dockerfile \ --cpu-count 4 --memory-mb 8192 --ready-cmd true export E2B_TEMPLATE=amp-orbs#!/usr/bin/env node // dispatch.mjs import { Sandbox } from 'e2b' const { ORB_OPERATION, ORB_ID, ORB_TOKEN, AMP_URL, E2B_TEMPLATE, } = process.env const metadata = { orbId: ORB_ID } const [existing] = await Sandbox.list({ query: { metadata, state: ['running', 'paused'] }, }).nextItems() if (ORB_OPERATION === 'spawn') { const timeoutMs = 60 * 60 * 1000 const sandbox = existing ? await Sandbox.connect(existing.sandboxId, { timeoutMs }) : await Sandbox.create(E2B_TEMPLATE, { metadata, timeoutMs, lifecycle: { onTimeout: 'pause' }, }) const envs = { ORB_TOKEN } if (AMP_URL) envs.AMP_URL = AMP_URL const bootstrap = await sandbox.commands.run('amp orb bootstrap', { user: 'user', envs, background: true, timeoutMs: 0, }) await bootstrap.disconnect() } else if (ORB_OPERATION === 'pause' && existing) { await Sandbox.pause(existing.sandboxId) } else if (ORB_OPERATION === 'delete' && existing) { await Sandbox.kill(existing.sandboxId) }#!/usr/bin/env bash # dispatch.sh set -euo pipefail export PATH="/usr/local/bin:/opt/homebrew/bin:$PATH" # "$ORB_IMAGE" is the Amp orb image. ids=$(container list --all --quiet) exists() { grep -Fxq "$ORB_ID" <<<"$ids"; } case "$ORB_OPERATION" in spawn) if exists; then container start "$ORB_ID" else container run --detach --init --rosetta \ --platform linux/amd64 --cpus 4 --memory 8G \ --name "$ORB_ID" "$ORB_IMAGE" sleep infinity fi # A bare --env NAME copies the value from the host. container exec --detach --env ORB_TOKEN --env AMP_URL \ "$ORB_ID" amp orb bootstrap ;; pause) if exists; then container stop "$ORB_ID" fi ;; delete) if exists; then container delete --force "$ORB_ID" fi ;; *) exit 1 ;; esac#!/usr/bin/env python3 # dispatch.py import os import modal # Needs `pip install modal` plus MODAL_TOKEN_ID and MODAL_TOKEN_SECRET. APP = "amp-orbs" app = modal.App.lookup(APP, create_if_missing=True) snapshots = modal.Dict.from_name("amp-orb-snapshots", create_if_missing=True) orb_id = os.environ["ORB_ID"] try: sandbox = modal.Sandbox.from_name(APP, orb_id) except modal.exception.NotFoundError: sandbox = None match os.environ["ORB_OPERATION"]: case "spawn": if sandbox is None: # Modal has no pause, so resume from the last snapshot. snapshot = snapshots.get(orb_id) if snapshot: image = modal.Image.from_id(snapshot) else: image = modal.Image.from_registry(os.environ["ORB_IMAGE"]) sandbox = modal.Sandbox.create( "sleep", "infinity", app=app, name=orb_id, image=image, cpu=4, memory=(16384, 16384), timeout=24 * 60 * 60, ) # Modal execs run as root; point bootstrap at the image user's home. bootstrap = "setsid amp orb bootstrap </dev/null >/dev/null 2>&1 &" sandbox.exec( "bash", "-c", bootstrap, env={ "ORB_TOKEN": os.environ["ORB_TOKEN"], "AMP_URL": os.environ.get("AMP_URL"), "HOME": "/home/user", "USER": "user", }, ).wait() case "pause": if sandbox: image_id = sandbox.snapshot_filesystem(timeout=120).object_id snapshots[orb_id] = image_id sandbox.terminate() case "delete": if sandbox: sandbox.terminate() snapshots.pop(orb_id, None)#!/usr/bin/env node // dispatch.mjs import { APIError, Sandbox, Snapshot } from '@vercel/sandbox' const { ORB_OPERATION, ORB_ID, ORB_IMAGE, ORB_TOKEN, AMP_URL } = process.env const credentials = { token: process.env.VERCEL_TOKEN, teamId: process.env.VERCEL_TEAM_ID, projectId: process.env.VERCEL_PROJECT_ID, } if (ORB_OPERATION === 'spawn') { const sandbox = await Sandbox.getOrCreate({ ...credentials, name: ORB_ID, // Copy Amp's image to VCR, then set ORB_IMAGE to its VCR URL. image: ORB_IMAGE, resources: { vcpus: 4 }, timeout: 60 * 60 * 1000, persistent: true, snapshotExpiration: 0, keepLastSnapshots: { count: 1, expiration: 0, deleteEvicted: true }, }) const setup = await sandbox.runCommand({ cmd: '/bin/bash', args: ['-c', 'hostname localhost && mkdir -p /vercel/sandbox'], sudo: true, }) if (setup.exitCode !== 0) throw new Error(await setup.stderr()) await sandbox.runCommand({ cmd: '/usr/bin/setpriv', args: [ '--reuid=user', '--regid=user', '--init-groups', '--', '/usr/bin/env', `ORB_TOKEN=${ORB_TOKEN}`, ...(AMP_URL ? [`AMP_URL=${AMP_URL}`] : []), 'HOME=/home/user', 'USER=user', '/bin/bash', '-lc', 'exec amp orb bootstrap', ], sudo: true, detached: true, }) } else if (ORB_OPERATION === 'pause' || ORB_OPERATION === 'delete') { try { const sandbox = await Sandbox.get({ ...credentials, name: ORB_ID, resume: false, }) if (ORB_OPERATION === 'delete') { if (sandbox.status === 'running') await sandbox.stop() for await (const saved of await sandbox.listSnapshots()) { if (saved.status !== 'created') continue const snapshot = await Snapshot.get({ ...credentials, snapshotId: saved.id, }) await snapshot.delete() } await sandbox.delete() } else if (sandbox.status === 'running') await sandbox.stop() } catch (error) { if (!(error instanceof APIError && error.response.status === 404)) { throw error } } }#!/usr/bin/env python3 # dispatch.py import os from uuid import uuid4 from daytona import ( Daytona, DaytonaNotFoundError, CreateSandboxFromImageParams, Resources, SessionExecuteRequest, SandboxState, ) daytona = Daytona() operation = os.environ['ORB_OPERATION'] try: sandbox = daytona.get(os.environ['ORB_ID']) except DaytonaNotFoundError: sandbox = None if operation == 'spawn': if sandbox is None: sandbox = daytona.create(CreateSandboxFromImageParams( name=os.environ['ORB_ID'], image=os.environ['ORB_IMAGE'], os_user='user', resources=Resources(cpu=4, memory=8, disk=10), auto_stop_interval=0, auto_delete_interval=-1, ), timeout=240) elif sandbox.state != SandboxState.STARTED: sandbox.start() env = {key: os.environ[key] for key in ('ORB_TOKEN', 'AMP_URL') if key in os.environ} sandbox.update_env(env, unset=['AMP_URL']) session = str(uuid4()) sandbox.process.create_session(session) sandbox.process.execute_session_command(session, SessionExecuteRequest( command="bash -lc 'exec amp orb bootstrap'", run_async=True, )) elif operation == 'pause' and sandbox: if sandbox.state == SandboxState.STARTED: sandbox.stop() elif operation == 'delete' and sandbox: sandbox.delete()#!/usr/bin/env bash # dispatch.sh set -euo pipefail # Pause/resume currently requires access enabled by exe.dev support. status=$(ssh exe.dev ls "$ORB_ID" --json | jq -r --arg id "$ORB_ID" '.vms[] | select(.vm_name == $id) | .status') case "$ORB_OPERATION" in spawn) if [[ -z "$status" ]]; then ssh exe.dev new --name="$ORB_ID" --image="$ORB_IMAGE" \ --cpu=2 --memory=8G --no-email elif [[ "$status" == paused ]]; then ssh exe.dev resume "$ORB_ID" fi { printf 'export ORB_TOKEN=%q\n' "$ORB_TOKEN" if [[ -n "${AMP_URL:-}" ]]; then printf 'export AMP_URL=%q\n' "$AMP_URL" fi cat <<'BOOTSTRAP' sudo -u user --preserve-env=ORB_TOKEN,AMP_URL bash -lc \ 'cd "$HOME"; nohup amp orb bootstrap </dev/null >.amp-bootstrap.log 2>&1 &' BOOTSTRAP } | ssh "$ORB_ID.exe.xyz" bash -s ;; pause) if [[ "$status" == running ]]; then ssh exe.dev pause "$ORB_ID" fi ;; delete) if [[ -n "$status" ]]; then ssh exe.dev rm "$ORB_ID" fi ;; esacUse Amp's Helm chart to run orbs on GKE, EKS, or AKS. Under the hood, it runs
amp orb providerwith a supplied dispatch program that handles spawning, pausing, and deleting orbs. You don't need to write a dispatch script yourself.- Create a custom orb provider in your Amp workspace and copy its token.
- Prepare a dedicated cluster with worker nodes and snapshot storage. Paused orbs are saved to storage and can resume on another worker node.
- Download the Kubernetes setup files.
The ZIP includes
gke.md,eks.md, andaks.mdwith the setup and Helm commands for each cloud, plus Terraform examples. Use the instructions for your cloud to install the chart and test your first orb.
These examples use Amp's pre-built
ORB_IMAGE, which includes the Amp CLI and other dependencies. You can use a different Linux image as long as you can startamp orb bootstrapin it (and it has the dependencies for other features). That process connects the orb to Amp so Amp can set up the environment and run the agent's tools.Once you have your dispatch program, go to your workspace settings (individuals can create a workspace for free), add a Custom Orb Provider, copy the token, and run
amp orb provider:$ chmod +x dispatch.sh $ export AMP_ORB_PROVIDER_TOKEN="<copied-token>" $ amp orb provider ./dispatch.shOnce that runs, open ampcode.com or the Amp macOS or iOS applications and create a new thread. Expand Orb and choose your provider under Self-Hosted.


And then submit your prompt. Amp will send a request to your provider to spawn an orb, clone your repository, run your setup files, and start the agent.
And thus begins, as they say, orbin' time. Self-hosted.
You Probably Shouldn't Self-Host Orbs
All that said: you probably shouldn't self-host orbs.
We built self-hosted orbs for enterprises that can't use the orbs we host, because regulations might restrict where their code runs, because they need access to internal networks, or because they need custom hardware attached.
If you're on an Enterprise plan, let us know and we'll help you set it up.
That's why the interface is so open: we want to support all the infrastructure our enterprise customers might have, as long as it meets the qualitative requirements above (fast-to-start, resumable machines that scale to zero, etc.). But that also means we only support our end of the contract, not every possible piece of infrastructure you can plug in.
Pricing
Self-hosted orbs are free for individuals and teams. Enterprises will be charged standard orb pricing starting October 29. Until then, self-hosted orbs are free for every workspace.
Getting Started
For more information on self-hosted orbs and how to run self-hosted orbs on Kubernetes, see the documentation.
-


![[link]](https://i.redd.it/5hqehcnkyexh1.jpeg)
![[link]](https://i.redd.it/zr8qiu1ri8xh1.png)
![[link]](https://i.redd.it/112k00aj66xh1.jpeg)